Posted On: 01/28/2014 12:36:22 AM
Post# of 338556

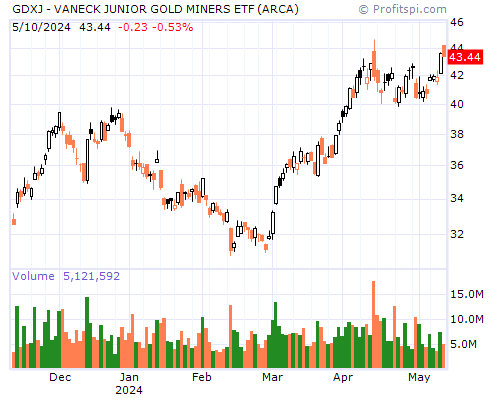
GDXJ Stock Chart and Technical Analysis - Mon, Jan 27th, 2014 $GDXJ
Period Moving Average Price Change Percent Change Average Volume
5 Day 36.39 -2.22 -6.07% 3,305,640
20 Day 33.67 +4.41 +14.72% 2,105,395
50 Day 32.29 -0.67 -1.91% 1,673,546
100 Day 36.17 -14.26 -29.33% 1,355,559
200 Day 40.24 -25.76 -42.85% 1,269,480
Year to Date 34.21 +3.31 +10.66% 2,248,718
Period Raw Stochastic Stochastic %K Stochastic %D Average True Range
9 Day 23.11% 56.88% 71.66% 1.64
14 Day 46.16% 67.74% 76.53% 1.48
20 Day 54.69% 73.23% 81.09% 1.41
50 Day 58.94% 75.39% 82.07% 1.47
100 Day 28.24% 35.35% 37.40% 1.71
Period Relative Strength Percent R Historic Volatility MACD Oscillator
9 Day 49.81% 76.89% 56.93% +0.25
14 Day 52.53% 53.84% 56.69% +1.38
20 Day 52.25% 45.31% 52.31% +2.24
50 Day 48.11% 41.06% 46.99% +3.62
100 Day 45.76% 71.76% 51.55% -0.27