Posted On: 01/28/2014 12:32:49 AM
Post# of 338556

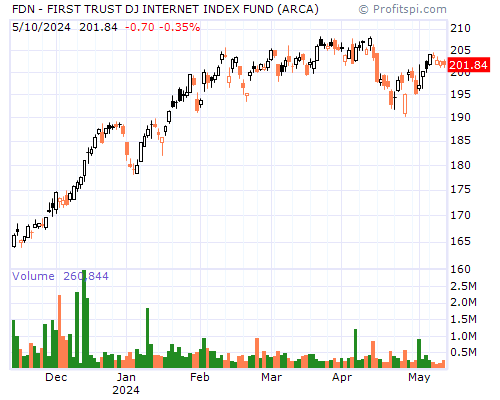
FDN Stock Chart and Technical Analysis - Mon, Jan 27th, 2014 $FDN
Period Moving Average Price Change Percent Change Average Volume
5 Day 60.49 -1.92 -3.16% 553,280
20 Day 60.06 -1.19 -1.98% 365,190
50 Day 58.13 +3.92 +7.14% 289,940
100 Day 55.94 +8.56 +17.04% 344,123
200 Day 51.30 +15.49 +35.77% 261,975
Year to Date 60.15 -1.07 -1.79% 385,812
Period Raw Stochastic Stochastic %K Stochastic %D Average True Range
9 Day 15.64% 49.34% 74.19% 0.91
14 Day 15.64% 50.81% 75.26% 0.85
20 Day 15.64% 50.81% 75.26% 0.82
50 Day 62.08% 79.35% 89.97% 0.78
100 Day 76.90% 87.51% 93.96% 0.74
Period Relative Strength Percent R Historic Volatility MACD Oscillator
9 Day 36.15% 84.36% 19.38% -0.62
14 Day 44.34% 84.36% 18.40% -0.38
20 Day 49.36% 84.36% 16.41% -0.09
50 Day 56.16% 37.92% 14.47% +1.84
100 Day 57.73% 23.10% 17.01% +4.03