Posted On: 01/28/2014 12:27:28 AM
Post# of 338556

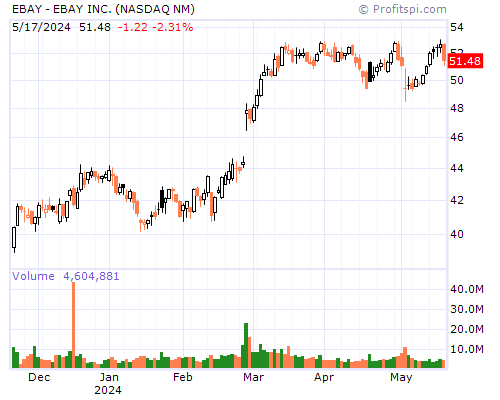
EBAY Stock Chart and Technical Analysis - Mon, Jan 27th, 2014 $EBAY
Period Moving Average Price Change Percent Change Average Volume
5 Day 54.15 -0.32 -0.60% 32,220,500
20 Day 53.42 -1.18 -2.18% 17,761,539
50 Day 52.54 +0.05 +0.09% 15,334,410
100 Day 53.01 +2.56 +5.09% 12,898,850
200 Day 53.13 -4.90 -8.48% 11,484,689
Year to Date 53.26 -1.99 -3.63% 19,771,912
Period Raw Stochastic Stochastic %K Stochastic %D Average True Range
9 Day 15.17% 52.63% 74.79% 1.16
14 Day 36.95% 61.66% 73.42% 1.14
20 Day 36.95% 61.66% 71.32% 1.13
50 Day 61.48% 76.57% 82.73% 1.14
100 Day 54.52% 67.91% 71.48% 1.16
Period Relative Strength Percent R Historic Volatility MACD Oscillator
9 Day 43.75% 84.83% 21.90% +0.24
14 Day 47.32% 63.05% 20.33% +0.75
20 Day 48.91% 63.05% 21.93% +0.64
50 Day 49.93% 38.52% 22.22% +1.53
100 Day 50.30% 45.48% 23.79% +1.06