Posted On: 01/28/2014 12:26:45 AM
Post# of 338556

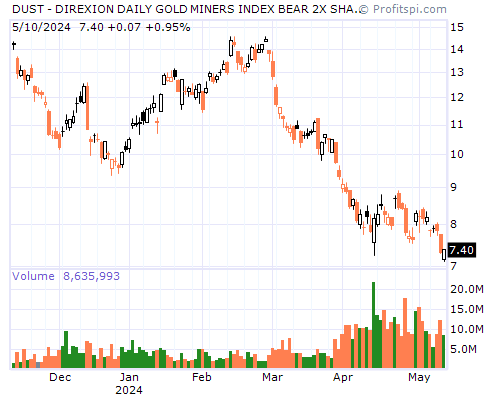
DUST Stock Chart and Technical Analysis - Mon, Jan 27th, 2014 $DUST
Period Moving Average Price Change Percent Change Average Volume
5 Day 30.72 +1.11 +3.52% 4,421,340
20 Day 36.93 -12.21 -27.25% 3,177,825
50 Day 41.20 -2.74 -7.75% 2,940,154
100 Day 37.23 +5.95 +22.33% 3,667,300
200 Day 41.23 -0.50 -1.51% 3,260,121
Year to Date 35.52 -11.45 -25.99% 3,426,541
Period Raw Stochastic Stochastic %K Stochastic %D Average True Range
9 Day 44.50% 22.63% 15.75% 3.24
14 Day 31.96% 16.79% 13.04% 3.29
20 Day 22.91% 11.91% 8.78% 3.35
50 Day 19.48% 10.21% 7.86% 3.62
100 Day 33.08% 25.99% 25.76% 3.72
Period Relative Strength Percent R Historic Volatility MACD Oscillator
9 Day 42.04% 55.50% 105.74% -1.95
14 Day 41.64% 68.04% 107.09% -4.22
20 Day 43.13% 77.09% 106.88% -6.37
50 Day 47.36% 80.52% 105.65% -10.64
100 Day 49.05% 66.92% 122.02% -6.67