Posted On: 01/28/2014 12:25:57 AM
Post# of 338556

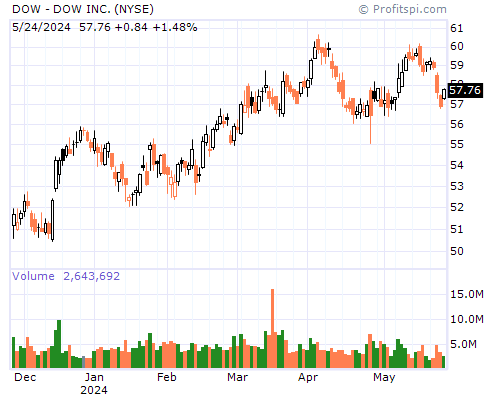
DOW Stock Chart and Technical Analysis - Mon, Jan 27th, 2014 $DOW
Period Moving Average Price Change Percent Change Average Volume
5 Day 44.57 +0.03 +0.07% 20,846,639
20 Day 43.65 -1.76 -3.92% 11,594,310
50 Day 41.93 +3.76 +9.56% 9,926,855
100 Day 40.78 +5.66 +15.12% 9,058,427
200 Day 37.66 +11.24 +35.28% 7,998,714
Year to Date 43.49 -1.30 -2.93% 12,465,459
Period Raw Stochastic Stochastic %K Stochastic %D Average True Range
9 Day 22.84% 37.37% 55.19% 1.17
14 Day 25.45% 38.24% 55.48% 1.05
20 Day 25.45% 38.24% 55.48% 0.98
50 Day 55.52% 63.15% 73.45% 0.86
100 Day 61.46% 68.07% 77.00% 0.80
Period Relative Strength Percent R Historic Volatility MACD Oscillator
9 Day 45.30% 77.16% 40.46% -0.11
14 Day 49.31% 74.55% 34.54% +0.30
20 Day 51.76% 74.55% 29.21% +0.10
50 Day 54.81% 44.48% 26.29% +1.81
100 Day 55.21% 38.54% 25.56% +2.96