Posted On: 01/28/2014 12:24:43 AM
Post# of 338556

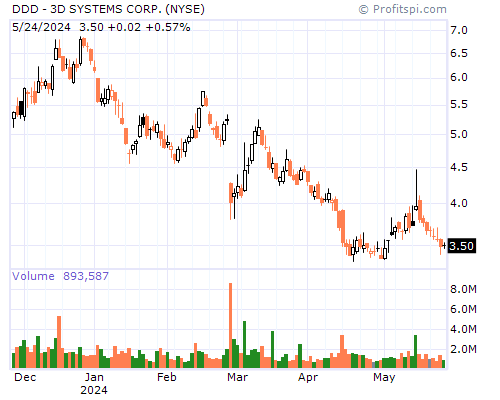
DDD Stock Chart and Technical Analysis - Mon, Jan 27th, 2014 $DDD
Period Moving Average Price Change Percent Change Average Volume
5 Day 82.99 -14.63 -16.16% 7,053,160
20 Day 90.42 -16.16 -17.55% 5,684,765
50 Day 83.48 -2.04 -2.62% 5,511,140
100 Day 70.30 +22.96 +43.37% 4,736,054
200 Day 57.70 +40.82 +116.36% 4,530,887
Year to Date 90.16 -17.03 -18.33% 6,054,265
Period Raw Stochastic Stochastic %K Stochastic %D Average True Range
9 Day 15.20% 14.26% 17.39% 5.09
14 Day 13.11% 12.92% 16.55% 4.76
20 Day 13.02% 12.85% 16.82% 4.50
50 Day 26.22% 41.60% 53.68% 3.69
100 Day 57.20% 66.12% 72.90% 3.05
Period Relative Strength Percent R Historic Volatility MACD Oscillator
9 Day 25.31% 84.80% 48.61% -6.16
14 Day 33.91% 86.89% 47.78% -8.91
20 Day 40.31% 86.98% 45.99% -10.07
50 Day 51.24% 73.78% 51.47% -3.13
100 Day 54.64% 42.80% 47.71% +10.05