Posted On: 01/28/2014 12:23:34 AM
Post# of 338556

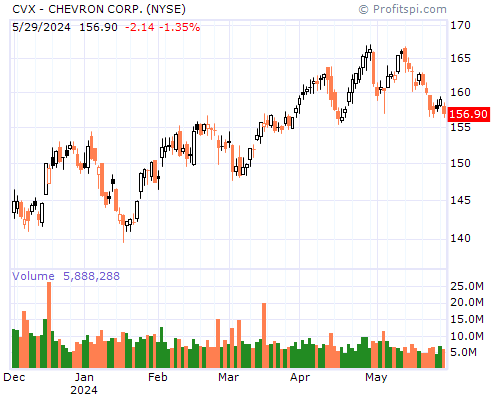
CVX Stock Chart and Technical Analysis - Mon, Jan 27th, 2014 $CVX
Period Moving Average Price Change Percent Change Average Volume
5 Day 118.38 -2.86 -2.40% 6,020,280
20 Day 121.38 -8.38 -6.71% 5,607,855
50 Day 121.77 -3.57 -2.97% 5,492,574
100 Day 121.36 -4.12 -3.42% 5,775,096
200 Day 121.61 -4.52 -3.74% 5,825,094
Year to Date 120.78 -8.48 -6.79% 5,913,941
Period Raw Stochastic Stochastic %K Stochastic %D Average True Range
9 Day 10.98% 5.31% 16.16% 1.56
14 Day 5.83% 2.99% 12.02% 1.54
20 Day 5.63% 2.88% 11.49% 1.52
50 Day 5.63% 2.88% 11.49% 1.51
100 Day 16.60% 21.66% 32.84% 1.53
Period Relative Strength Percent R Historic Volatility MACD Oscillator
9 Day 26.17% 89.02% 14.40% -1.72
14 Day 31.90% 94.17% 14.97% -3.01
20 Day 36.22% 94.37% 13.57% -4.34
50 Day 43.96% 94.37% 13.81% -4.73
100 Day 47.60% 83.40% 12.90% -4.32