Posted On: 01/28/2014 12:19:31 AM
Post# of 338556

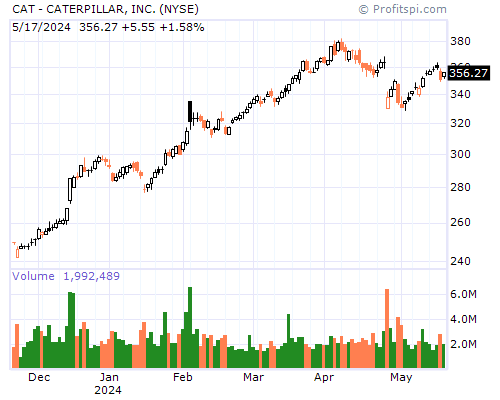
CAT Stock Chart and Technical Analysis - Mon, Jan 27th, 2014 $CAT
Period Moving Average Price Change Percent Change Average Volume
5 Day 89.24 -0.15 -0.16% 9,139,261
20 Day 90.08 +0.14 +0.15% 5,856,900
50 Day 87.38 +7.44 +8.87% 5,391,892
100 Day 86.17 +8.78 +10.64% 5,254,416
200 Day 85.42 +5.59 +6.52% 5,864,067
Year to Date 89.95 +0.48 +0.53% 6,355,235
Period Raw Stochastic Stochastic %K Stochastic %D Average True Range
9 Day 73.91% 28.74% 21.29% 2.05
14 Day 73.91% 28.74% 22.80% 1.75
20 Day 73.91% 28.74% 23.44% 1.58
50 Day 83.14% 59.81% 60.92% 1.37
100 Day 83.14% 60.26% 61.46% 1.40
Period Relative Strength Percent R Historic Volatility MACD Oscillator
9 Day 57.02% 26.09% 36.99% -1.64
14 Day 56.91% 26.09% 30.10% -1.41
20 Day 57.12% 26.09% 26.08% -1.44
50 Day 55.72% 16.86% 19.40% +1.26
100 Day 53.11% 16.86% 19.80% +2.47