Posted On: 01/28/2014 12:14:02 AM
Post# of 338556

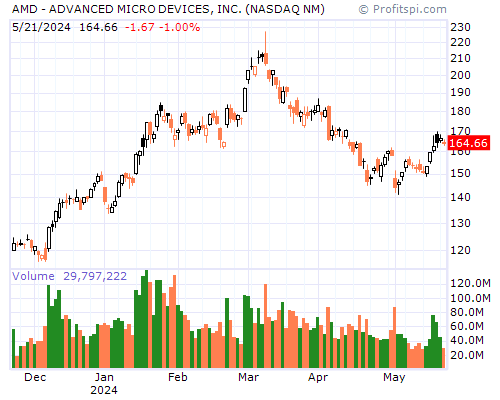
AMD Stock Chart and Technical Analysis - Mon, Jan 27th, 2014 $AMD
Period Moving Average Price Change Percent Change Average Volume
5 Day 3.67 -0.77 -18.42% 51,179,258
20 Day 4.00 -0.39 -10.26% 36,531,766
50 Day 3.75 -0.03 -0.87% 23,869,646
100 Day 3.70 +0.14 +4.28% 27,617,551
200 Day 3.70 +0.89 +35.32% 28,592,326
Year to Date 4.03 -0.46 -11.89% 40,736,395
Period Raw Stochastic Stochastic %K Stochastic %D Average True Range
9 Day 4.80% 4.59% 5.62% 0.19
14 Day 4.80% 4.59% 8.10% 0.17
20 Day 4.80% 4.59% 9.33% 0.16
50 Day 6.30% 14.91% 27.44% 0.14
100 Day 23.72% 29.49% 38.18% 0.14
Period Relative Strength Percent R Historic Volatility MACD Oscillator
9 Day 24.36% 95.20% 73.27% -0.46
14 Day 32.02% 95.20% 63.47% -0.53
20 Day 37.26% 95.20% 58.07% -0.50
50 Day 45.63% 93.70% 41.35% -0.25
100 Day 48.35% 76.28% 45.07% -0.20