Posted On: 01/27/2014 5:35:17 PM
Post# of 338556

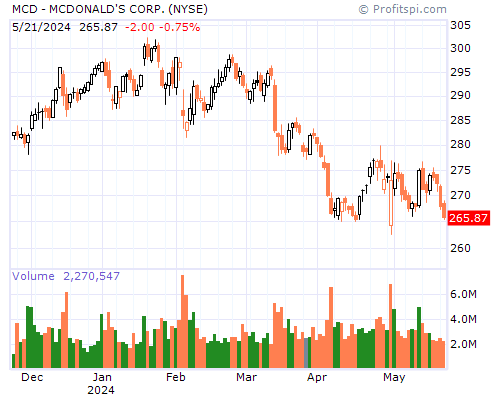
MCD Stock Chart and Technical Analysis - Mon, Jan 27th, 2014 $MCD
Period Moving Average Price Change Percent Change Average Volume
5 Day 11.90 +0.28 +2.46% 66,720,813
20 Day 10.93 +1.21 +11.60% 38,662,969
50 Day 10.08 +2.72 +30.49% 27,957,023
100 Day 9.33 +3.92 +50.78% 28,319,793
200 Day 8.75 +3.32 +39.90% 22,966,115
Year to Date 10.98 +1.01 +9.50% 42,889,609
Period Raw Stochastic Stochastic %K Stochastic %D Average True Range
9 Day 68.52% 73.24% 82.84% 0.41
14 Day 72.69% 75.77% 84.07% 0.37
20 Day 72.69% 75.77% 84.07% 0.34
50 Day 80.79% 82.96% 88.79% 0.27
100 Day 85.19% 86.92% 91.41% 0.23
Period Relative Strength Percent R Historic Volatility MACD Oscillator
9 Day 61.85% 31.48% 48.87% +0.29
14 Day 63.54% 27.31% 51.18% +0.64
20 Day 64.11% 27.31% 44.56% +0.79
50 Day 62.87% 19.21% 31.79% +1.64
100 Day 59.64% 14.81% 34.16% +2.39