Posted On: 01/27/2014 2:04:37 PM
Post# of 338556

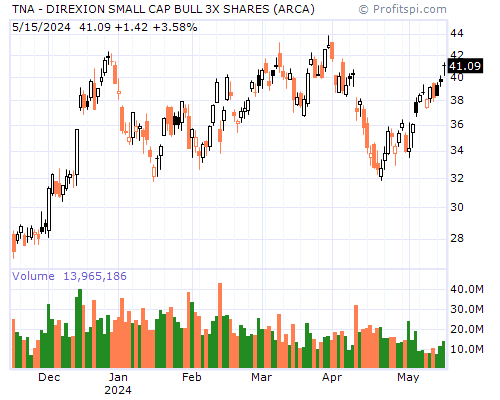
TNA Stock Chart and Technical Analysis - Mon, Jan 27th, 2014 $TNA
Period Moving Average Price Change Percent Change Average Volume
5 Day 11.90 +0.28 +2.46% 64,378,641
20 Day 10.93 +1.21 +11.60% 38,077,426
50 Day 10.08 +2.72 +30.49% 27,722,807
100 Day 9.33 +3.92 +50.78% 28,202,684
200 Day 8.75 +3.32 +39.90% 22,907,561
Year to Date 10.98 +1.01 +9.50% 42,200,734
Period Relative Strength Percent R Historic Volatility MACD Oscillator
9 Day 61.85% 31.48% 48.87% +0.29
14 Day 63.54% 27.31% 51.18% +0.64
20 Day 64.11% 27.31% 44.56% +0.79
50 Day 62.87% 19.21% 31.79% +1.64
100 Day 59.64% 14.81% 34.16% +2.39