Posted On: 01/27/2014 2:31:00 AM
Post# of 338555

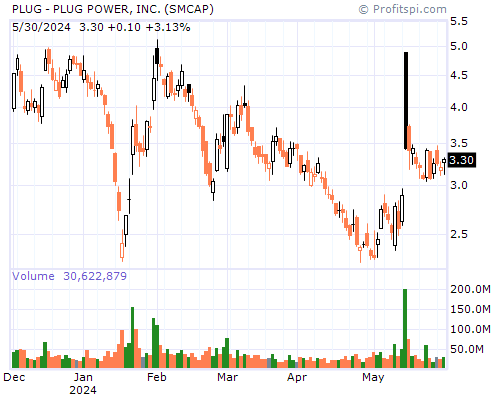
PLUG Stock Chart and Technical Analysis - Mon, Jan 27th, 2014 $PLUG
Period Moving Average Price Change Percent Change Average Volume
5 Day 3.24 -0.74 -20.85% 14,366,721
20 Day 3.02 +1.06 +60.57% 35,079,672
50 Day 1.96 +2.28 +430.19% 20,611,254
100 Day 1.28 +2.29 +440.38% 12,199,051
200 Day 0.81 +2.64 +1,552.94% 7,665,515
Year to Date 3.37 +1.26 +81.29% 42,938,227
Period Raw Stochastic Stochastic %K Stochastic %D Average True Range
9 Day 4.14% 5.24% 8.64% 0.42
14 Day 15.38% 30.15% 43.08% 0.40
20 Day 37.61% 45.57% 51.48% 0.36
50 Day 52.28% 58.43% 63.08% 0.23
100 Day 53.03% 59.03% 63.47% 0.15
Period Relative Strength Percent R Historic Volatility MACD Oscillator
9 Day 42.85% 95.86% 66.93% -0.34
14 Day 50.23% 84.62% 221.80% -0.42
20 Day 53.97% 62.39% 236.74% +0.06
50 Day 58.51% 47.72% 215.07% +1.12
100 Day 58.90% 46.97% 173.16% +1.79