Posted On: 01/27/2014 2:30:15 AM
Post# of 338555

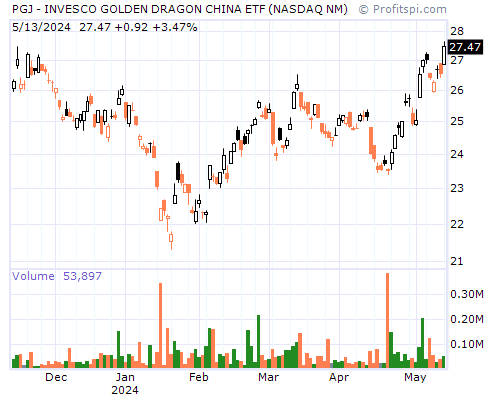
PGJ Stock Chart and Technical Analysis - Mon, Jan 27th, 2014 $PGJ
Period Moving Average Price Change Percent Change Average Volume
5 Day 30.54 -2.54 -8.12% 241,380
20 Day 30.54 -1.05 -3.52% 149,140
50 Day 29.72 +0.45 +1.59% 121,732
100 Day 29.14 +3.38 +13.32% 179,864
200 Day 25.52 +9.74 +51.21% 119,281
Year to Date 30.66 -1.56 -5.15% 168,637
Period Raw Stochastic Stochastic %K Stochastic %D Average True Range
9 Day 0.35% 41.21% 60.41% 0.80
14 Day 0.35% 41.23% 61.51% 0.72
20 Day 0.35% 44.05% 67.21% 0.68
50 Day 21.58% 61.53% 79.13% 0.61
100 Day 50.77% 75.95% 86.59% 0.53
Period Relative Strength Percent R Historic Volatility MACD Oscillator
9 Day 32.29% 99.65% 38.42% -0.50
14 Day 38.70% 99.65% 37.43% -0.52
20 Day 42.81% 99.65% 32.36% -0.35
50 Day 50.29% 78.42% 26.84% +0.47
100 Day 53.55% 49.23% 27.59% +1.05