Posted On: 01/27/2014 2:29:04 AM
Post# of 338555

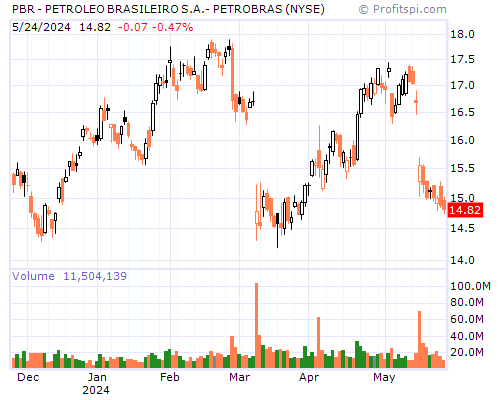
PBR Stock Chart and Technical Analysis - Mon, Jan 27th, 2014 $PBR
Period Moving Average Price Change Percent Change Average Volume
5 Day 12.23 -0.78 -6.22% 18,939,020
20 Day 12.82 -1.90 -13.91% 18,103,186
50 Day 14.18 -4.71 -28.60% 17,262,715
100 Day 15.01 -1.76 -13.02% 16,584,584
200 Day 15.33 -5.43 -31.59% 17,225,467
Year to Date 12.61 -2.02 -14.66% 20,052,012
Period Raw Stochastic Stochastic %K Stochastic %D Average True Range
9 Day 11.94% 23.97% 25.15% 0.39
14 Day 8.99% 15.28% 15.23% 0.40
20 Day 7.11% 12.03% 12.64% 0.41
50 Day 2.51% 3.73% 3.79% 0.46
100 Day 2.51% 3.73% 3.79% 0.49
Period Relative Strength Percent R Historic Volatility MACD Oscillator
9 Day 26.63% 88.06% 30.22% -0.22
14 Day 29.11% 91.01% 29.57% -0.39
20 Day 31.64% 92.89% 28.31% -0.68
50 Day 39.60% 97.49% 41.12% -2.03
100 Day 43.40% 97.49% 39.40% -2.87