Posted On: 01/27/2014 2:27:33 AM
Post# of 338555

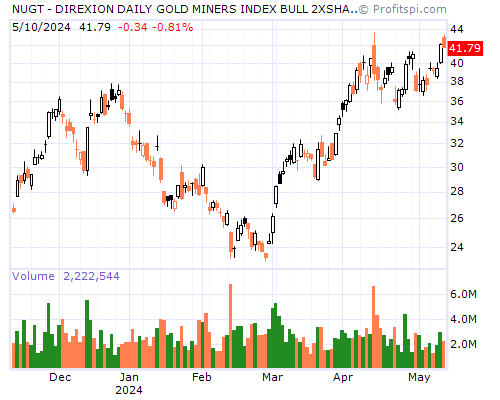
NUGT Stock Chart and Technical Analysis - Mon, Jan 27th, 2014 $NUGT
Period Moving Average Price Change Percent Change Average Volume
5 Day 36.97 +4.49 +13.54% 6,242,340
20 Day 31.67 +10.63 +39.34% 5,217,795
50 Day 31.23 -5.55 -12.85% 5,840,538
100 Day 41.81 -38.38 -50.48% 5,313,984
200 Day 65.70 -173.05 -82.13% 3,768,622
Year to Date 32.79 +10.24 +37.36% 5,393,813
Period Raw Stochastic Stochastic %K Stochastic %D Average True Range
9 Day 75.15% 76.80% 82.36% 3.07
14 Day 79.56% 78.75% 83.47% 2.89
20 Day 83.11% 83.27% 87.02% 2.94
50 Day 64.55% 60.98% 59.09% 4.66
100 Day 23.18% 21.88% 20.28% 10.20
Period Relative Strength Percent R Historic Volatility MACD Oscillator
9 Day 65.80% 24.85% 91.99% +1.94
14 Day 61.66% 20.44% 91.23% +3.77
20 Day 56.86% 16.89% 92.75% +5.24
50 Day 46.39% 35.45% 103.52% +5.67
100 Day 43.08% 76.82% 118.04% -4.91