Posted On: 01/27/2014 2:23:48 AM
Post# of 338555

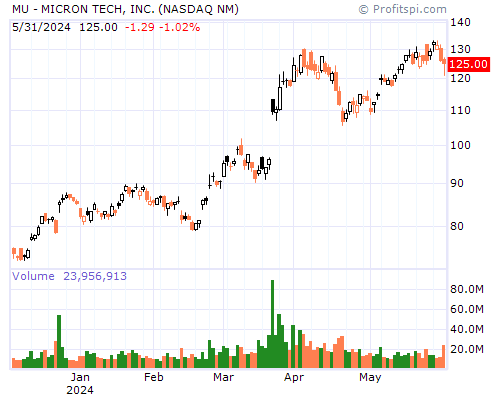
MU Stock Chart and Technical Analysis - Mon, Jan 27th, 2014 $MU
Period Moving Average Price Change Percent Change Average Volume
5 Day 23.14 -0.21 -0.91% 33,491,840
20 Day 22.57 +1.10 +5.04% 35,204,828
50 Day 21.70 +4.65 +25.45% 39,830,887
100 Day 19.38 +9.35 +68.90% 43,622,230
200 Day 15.85 +12.83 +127.16% 40,445,902
Year to Date 22.81 +1.17 +5.38% 38,949,613
Period Raw Stochastic Stochastic %K Stochastic %D Average True Range
9 Day 40.54% 73.20% 67.02% 0.80
14 Day 59.07% 71.59% 69.11% 0.79
20 Day 59.07% 71.59% 69.11% 0.78
50 Day 75.24% 83.29% 82.50% 0.69
100 Day 85.37% 90.05% 89.42% 0.59
Period Relative Strength Percent R Historic Volatility MACD Oscillator
9 Day 50.74% 59.46% 36.44% +0.16
14 Day 53.33% 40.93% 54.27% +0.38
20 Day 55.10% 40.93% 48.42% +0.84
50 Day 58.56% 24.76% 41.62% +1.70
100 Day 59.76% 14.63% 38.46% +4.03