Posted On: 01/27/2014 1:44:13 AM
Post# of 338557

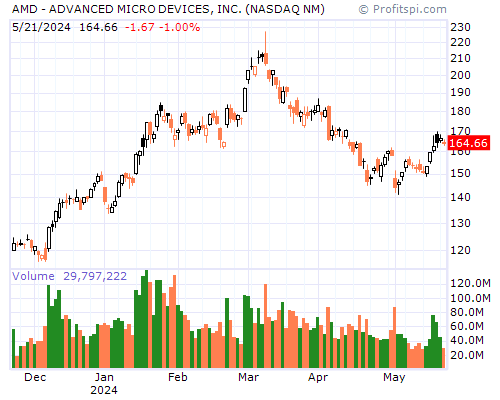
AMD Stock Chart and Technical Analysis - Mon, Jan 27th, 2014 $AMD
Period Moving Average Price Change Percent Change Average Volume
5 Day 3.82 -0.91 -20.78% 54,085,359
20 Day 4.02 -0.30 -7.96% 35,458,223
50 Day 3.76 +0.13 +3.89% 23,646,193
100 Day 3.70 +0.20 +6.12% 27,459,402
200 Day 3.70 +0.86 +32.95% 28,500,268
Year to Date 4.07 -0.40 -10.34% 41,322,523
Period Raw Stochastic Stochastic %K Stochastic %D Average True Range
9 Day 5.04% 3.34% 9.26% 0.20
14 Day 5.04% 3.34% 17.02% 0.17
20 Day 5.04% 3.34% 20.50% 0.16
50 Day 11.02% 24.00% 41.68% 0.14
100 Day 27.56% 35.04% 49.00% 0.14
Period Relative Strength Percent R Historic Volatility MACD Oscillator
9 Day 25.84% 94.96% 73.65% -0.46
14 Day 33.45% 94.96% 66.36% -0.49
20 Day 38.56% 94.96% 58.10% -0.43
50 Day 46.37% 88.98% 41.68% -0.17
100 Day 48.72% 72.44% 44.98% -0.11