Posted On: 01/26/2014 11:05:53 PM
Post# of 338557

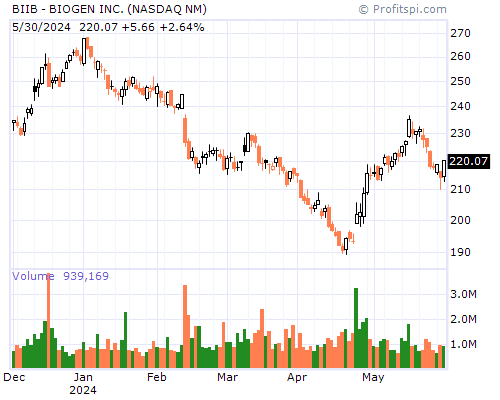
BIIB Stock Chart and Technical Analysis - Sun, Jan 26th, 2014 $BIIB
Period Moving Average Price Change Percent Change Average Volume
5 Day 11.84 +0.40 +3.62% 71,936,977
20 Day 10.87 +1.08 +10.42% 37,874,363
50 Day 10.02 +2.41 +26.69% 27,759,473
100 Day 9.29 +3.74 +48.57% 28,328,064
200 Day 8.74 +3.13 +37.67% 22,892,162
Year to Date 10.94 +0.81 +7.62% 43,821,363
Period Relative Strength Percent R Historic Volatility MACD Oscillator
9 Day 58.54% 38.77% 49.96% +0.66
14 Day 61.24% 35.34% 51.22% +0.91
20 Day 62.34% 35.34% 44.37% +1.04
50 Day 61.90% 24.86% 31.91% +1.89
100 Day 59.00% 19.05% 34.09% +2.62