Posted On: 01/21/2014 2:00:53 PM
Post# of 338556

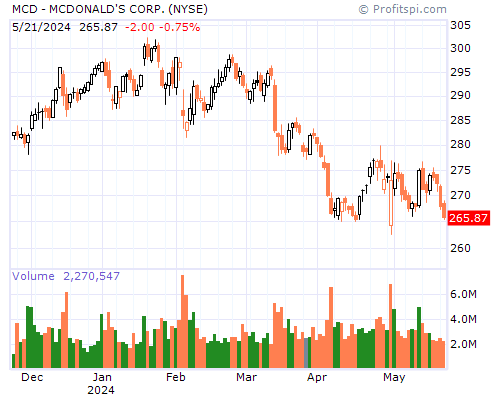
MCD Stock Chart and Technical Analysis - Tue, Jan 21st, 2014 $MCD
Period Moving Average Price Change Percent Change Average Volume
5 Day 11.12 +2.19 +21.68% 43,023,676
20 Day 10.61 +2.32 +23.27% 28,717,080
50 Day 9.85 +2.63 +27.23% 24,957,162
100 Day 9.16 +4.37 +55.18% 26,811,008
200 Day 8.68 +4.05 +49.15% 22,237,586
Year to Date 10.73 +1.66 +15.62% 35,878,145
Period Raw Stochastic Stochastic %K Stochastic %D Average True Range
9 Day 99.19% 93.06% 91.14% 0.41
14 Day 99.19% 93.06% 91.14% 0.35
20 Day 99.19% 93.29% 92.07% 0.32
50 Day 99.43% 95.69% 94.88% 0.26
100 Day 99.57% 96.91% 96.43% 0.22
Period Relative Strength Percent R Historic Volatility MACD Oscillator
9 Day 83.28% 0.81% 54.41% +0.75
14 Day 79.41% 0.81% 46.71% +0.84
20 Day 76.47% 0.81% 41.13% +0.95
50 Day 69.00% 0.57% 35.47% +1.71
100 Day 62.97% 0.43% 33.67% +2.40