Posted On: 01/21/2014 12:56:18 PM
Post# of 338556

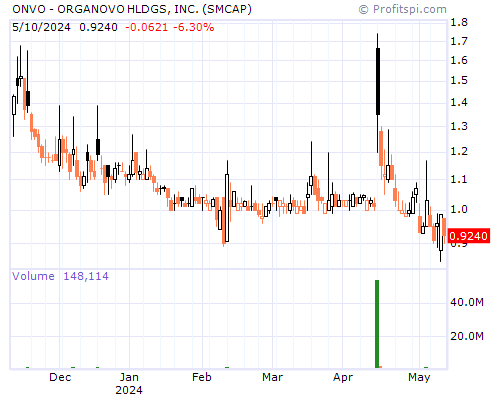
ONVO Stock Chart and Technical Analysis - Tue, Jan 21st, 2014 $ONVO
Period Moving Average Price Change Percent Change Average Volume
5 Day 11.10 +2.08 +20.59% 39,809,371
20 Day 10.60 +2.21 +22.17% 27,913,502
50 Day 9.85 +2.52 +26.09% 24,635,730
100 Day 9.16 +4.26 +53.79% 26,650,293
200 Day 8.68 +3.94 +47.82% 22,157,229
Year to Date 10.72 +1.55 +14.58% 34,641,871
Period Raw Stochastic Stochastic %K Stochastic %D Average True Range
9 Day 98.33% 92.78% 91.04% 0.40
14 Day 98.33% 92.78% 91.04% 0.35
20 Day 98.33% 93.00% 91.97% 0.31
50 Day 98.84% 95.49% 94.81% 0.26
100 Day 99.12% 96.76% 96.38% 0.22
Period Relative Strength Percent R Historic Volatility MACD Oscillator
9 Day 82.57% 1.67% 51.89% +0.72
14 Day 78.72% 1.67% 44.52% +0.81
20 Day 75.83% 1.67% 39.36% +0.92
50 Day 68.54% 1.16% 34.57% +1.68
100 Day 62.64% 0.88% 33.20% +2.36