Posted On: 01/21/2014 10:29:42 AM
Post# of 338559

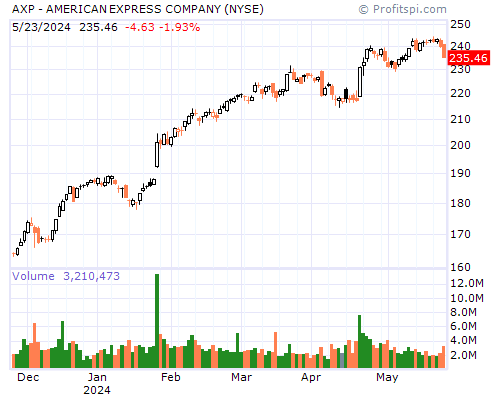
AXP Stock Chart and Technical Analysis - Tue, Jan 21st, 2014 $AXP
Period Moving Average Price Change Percent Change Average Volume
5 Day 11.04 +1.78 +17.62% 33,917,379
20 Day 10.59 +1.91 +19.16% 26,440,504
50 Day 9.84 +2.22 +22.98% 24,046,531
100 Day 9.16 +3.96 +50.00% 26,355,693
200 Day 8.68 +3.64 +44.17% 22,009,928
Year to Date 10.70 +1.25 +11.76% 32,375,723
Period Raw Stochastic Stochastic %K Stochastic %D Average True Range
9 Day 85.77% 88.59% 89.64% 0.40
14 Day 85.77% 88.59% 89.64% 0.35
20 Day 85.77% 88.82% 90.58% 0.31
50 Day 90.12% 92.58% 93.84% 0.26
100 Day 92.51% 94.56% 95.65% 0.22
Period Relative Strength Percent R Historic Volatility MACD Oscillator
9 Day 80.25% 14.23% 46.39% +0.66
14 Day 76.56% 14.23% 39.58% +0.73
20 Day 73.89% 14.23% 35.42% +0.84
50 Day 67.22% 9.88% 32.60% +1.58
100 Day 61.72% 7.49% 32.18% +2.27