Posted On: 01/19/2014 5:31:24 PM
Post# of 338556

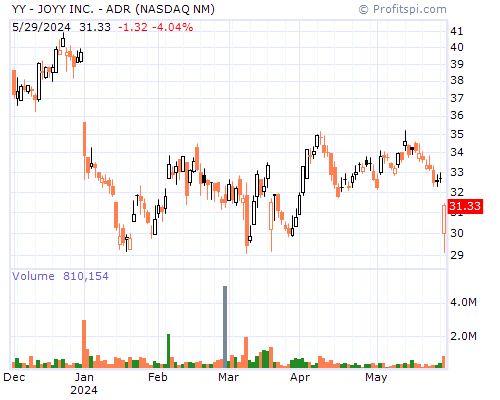
YY Stock Chart and Technical Analysis - Sun, Jan 19th, 2014 $YY
Period Moving Average Price Change Percent Change Average Volume
5 Day 68.61 +7.00 +10.87% 2,392,220
20 Day 57.93 +23.55 +49.22% 1,842,345
50 Day 53.26 +17.51 +32.49% 1,516,870
100 Day 50.32 +29.77 +71.51% 1,687,990
200 Day 39.49 +55.18 +340.20% 1,277,427
Year to Date 63.48 +21.12 +42.00% 2,634,692
Period Raw Stochastic Stochastic %K Stochastic %D Average True Range
9 Day 90.73% 91.89% 91.47% 3.77
14 Day 94.12% 94.10% 92.89% 3.41
20 Day 94.60% 94.59% 93.51% 3.22
50 Day 94.84% 94.75% 93.74% 2.96
100 Day 95.97% 95.96% 95.39% 2.57
Period Relative Strength Percent R Historic Volatility MACD Oscillator
9 Day 80.79% 9.27% 58.73% +5.10
14 Day 76.71% 5.88% 62.19% +9.54
20 Day 72.44% 5.40% 55.79% +13.17
50 Day 63.50% 5.16% 60.51% +17.84
100 Day 60.87% 4.03% 70.40% +20.77