Posted On: 01/12/2014 5:58:11 PM
Post# of 2561

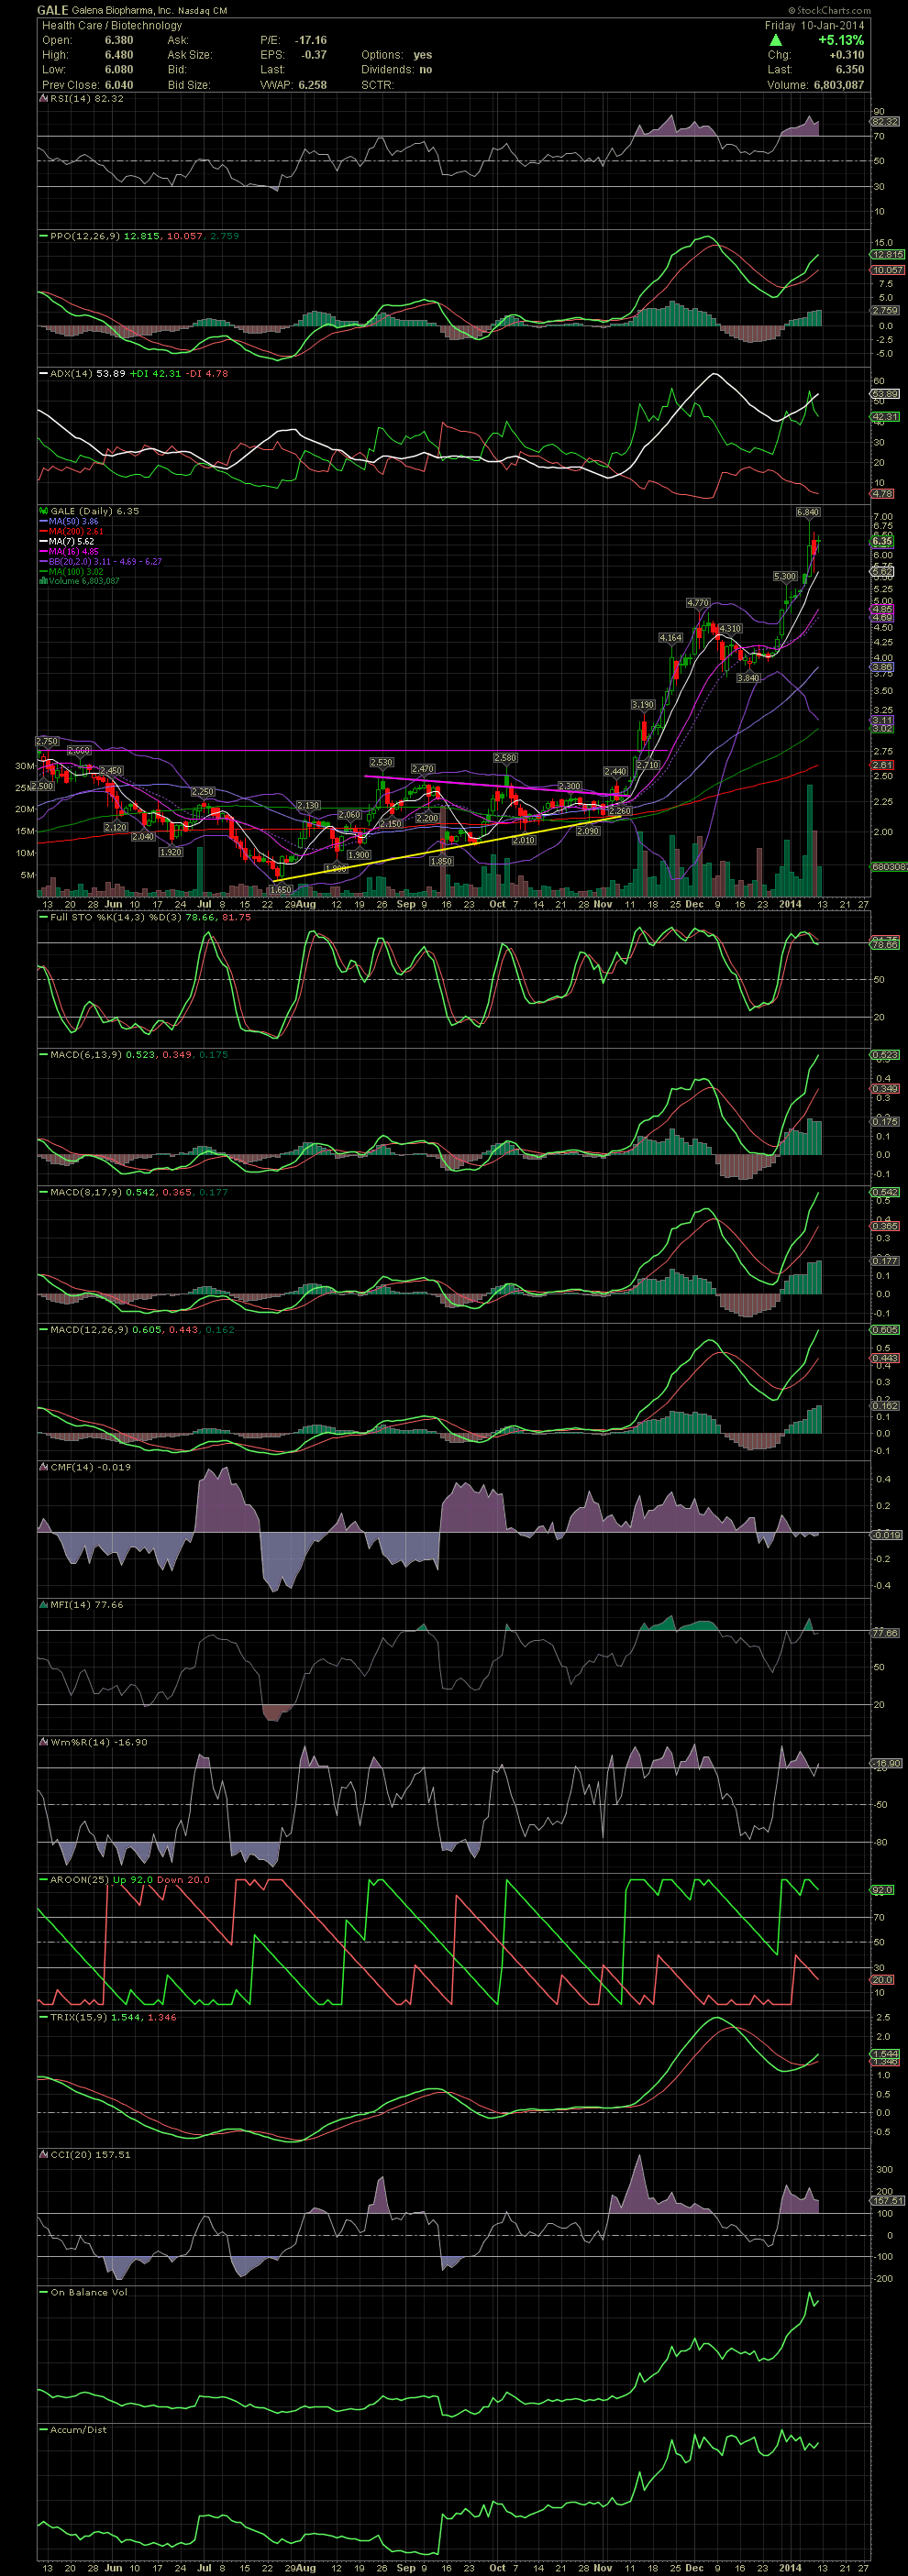
GALE Daily Chart ~ New Highs Last Week But Getting Overbought
I'm not in GALE but a few friends have done very well with it. Please note the chart pattern from Aug to Nov and prior to the break to the upside. Look familiar? A rising support line with a declining tops line and the horizontal resistance of a previous high. Note the positioning of the FullSto and MACDs in early Nov as they broke to the green with positive crossovers. Fast forward to the negative crossover in early Dec. As the stock pulled back, note what came next towards late Dec as the same indicators once again crossed to the upside. The stock traded as high as 6.84, outside the upper bollie, and has since pulled back over .50. GALE is now at new highs but the FullSto and MACDs are getting into overbought levels. I see a swing trade exit coming to the charts that I follow in the near future. I know a few friends who pulled off the three swings trades already and are awaiting the outcome of their current trade Nice trading! GLTA
I'm not in GALE but a few friends have done very well with it. Please note the chart pattern from Aug to Nov and prior to the break to the upside. Look familiar? A rising support line with a declining tops line and the horizontal resistance of a previous high. Note the positioning of the FullSto and MACDs in early Nov as they broke to the green with positive crossovers. Fast forward to the negative crossover in early Dec. As the stock pulled back, note what came next towards late Dec as the same indicators once again crossed to the upside. The stock traded as high as 6.84, outside the upper bollie, and has since pulled back over .50. GALE is now at new highs but the FullSto and MACDs are getting into overbought levels. I see a swing trade exit coming to the charts that I follow in the near future. I know a few friends who pulled off the three swings trades already and are awaiting the outcome of their current trade Nice trading! GLTA