Posted On: 01/11/2014 11:01:18 PM
Post# of 2561
XRX Daily Chart ~ Trending With a Slight Negative Bias
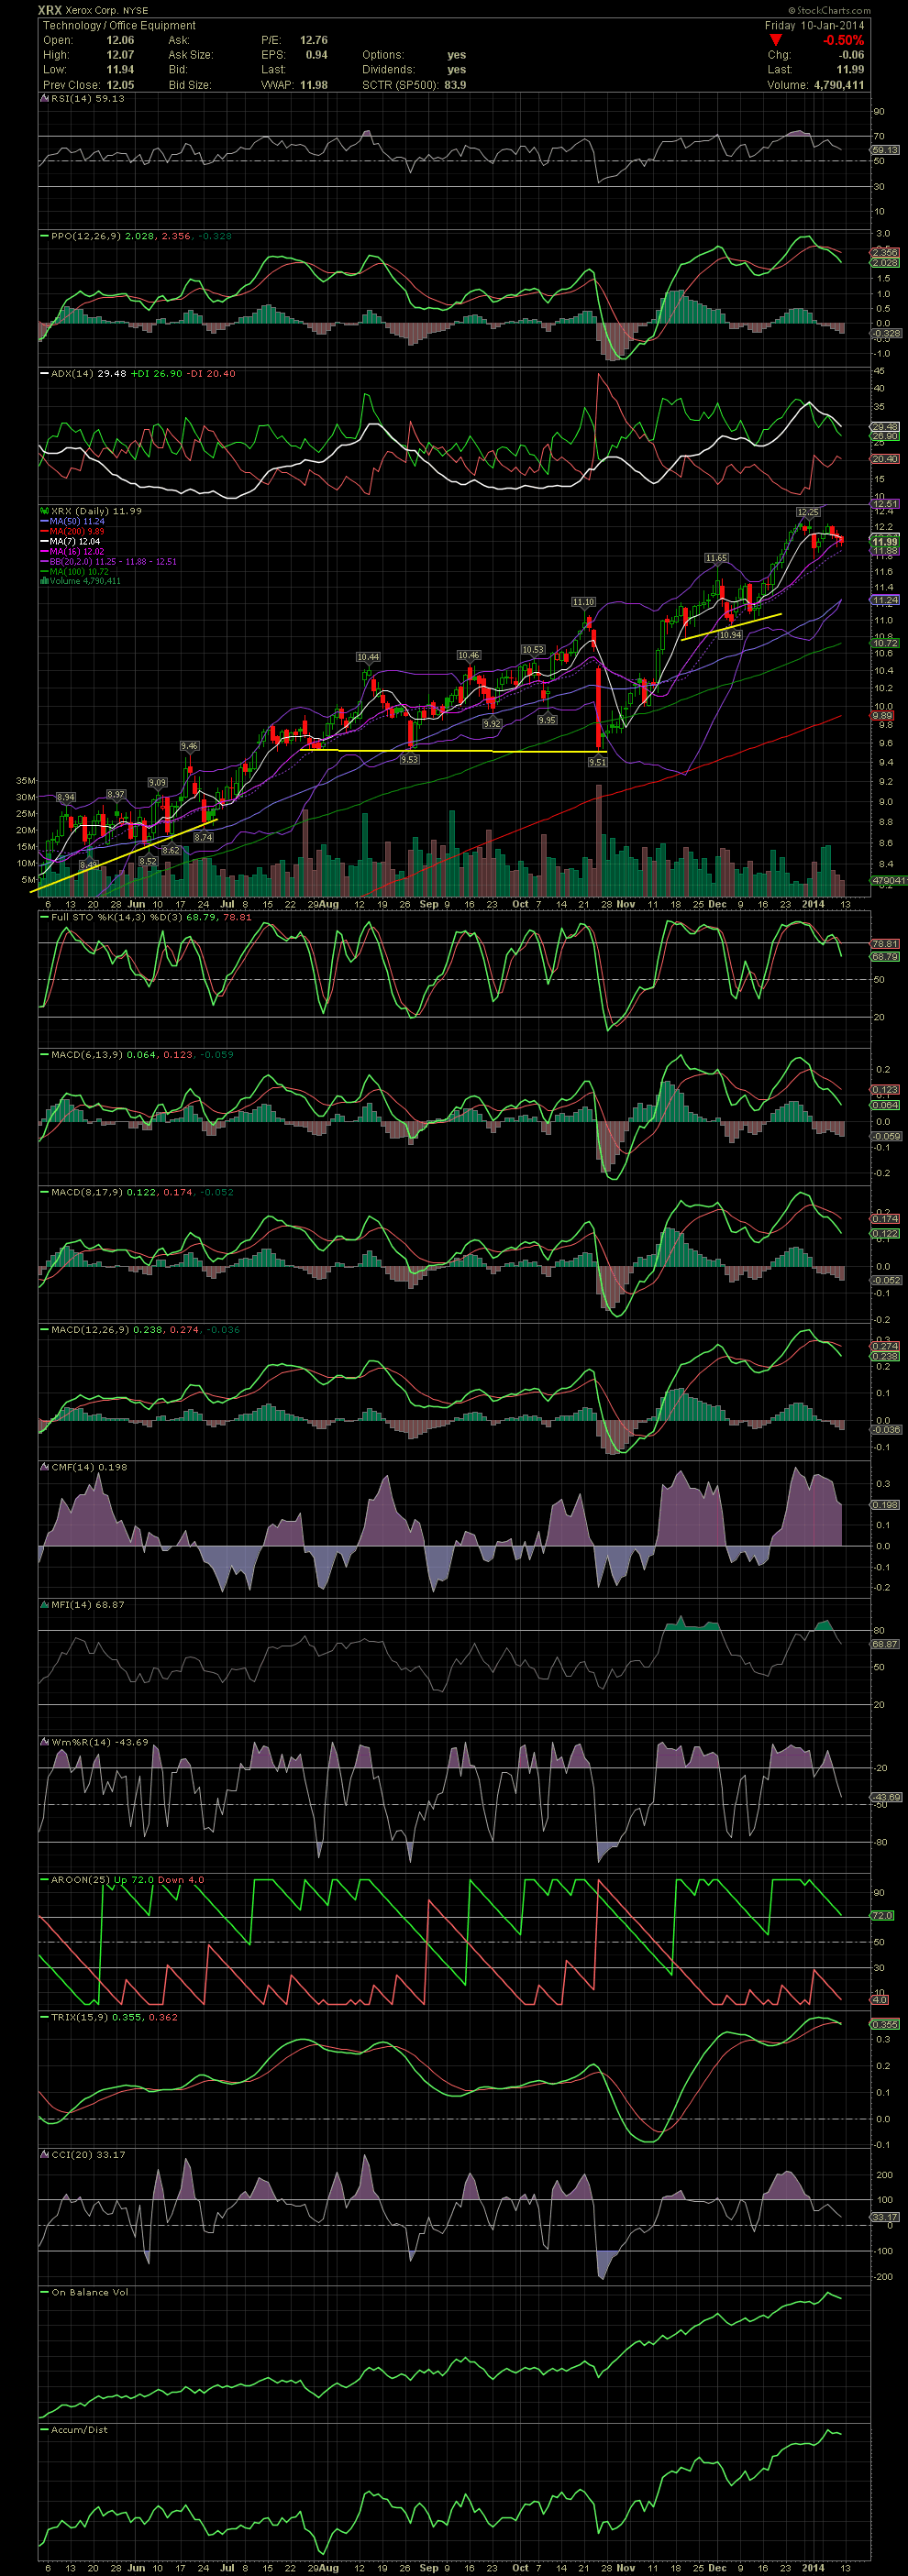
Although our exits over a week ago in the low 12.00s for a great swing trade, the stock is simple trading sideways. Although XRX is only down approx 1% from the exits, the FullSto and MACDs are beginning to show divergence after a negative crossover. The MA20 is sitting at 11.88, and that needs to hold. If that level breaks, I see a test of the previous high at 11.65 and the MA50, which is currently rising at 11.24. Might XRX establish a bottom at the 12.00 level, or breakdown, no one knows. For now we'll sit and wait. GLTA

Although our exits over a week ago in the low 12.00s for a great swing trade, the stock is simple trading sideways. Although XRX is only down approx 1% from the exits, the FullSto and MACDs are beginning to show divergence after a negative crossover. The MA20 is sitting at 11.88, and that needs to hold. If that level breaks, I see a test of the previous high at 11.65 and the MA50, which is currently rising at 11.24. Might XRX establish a bottom at the 12.00 level, or breakdown, no one knows. For now we'll sit and wait. GLTA


