Posted On: 01/11/2014 7:34:23 PM
Post# of 2561
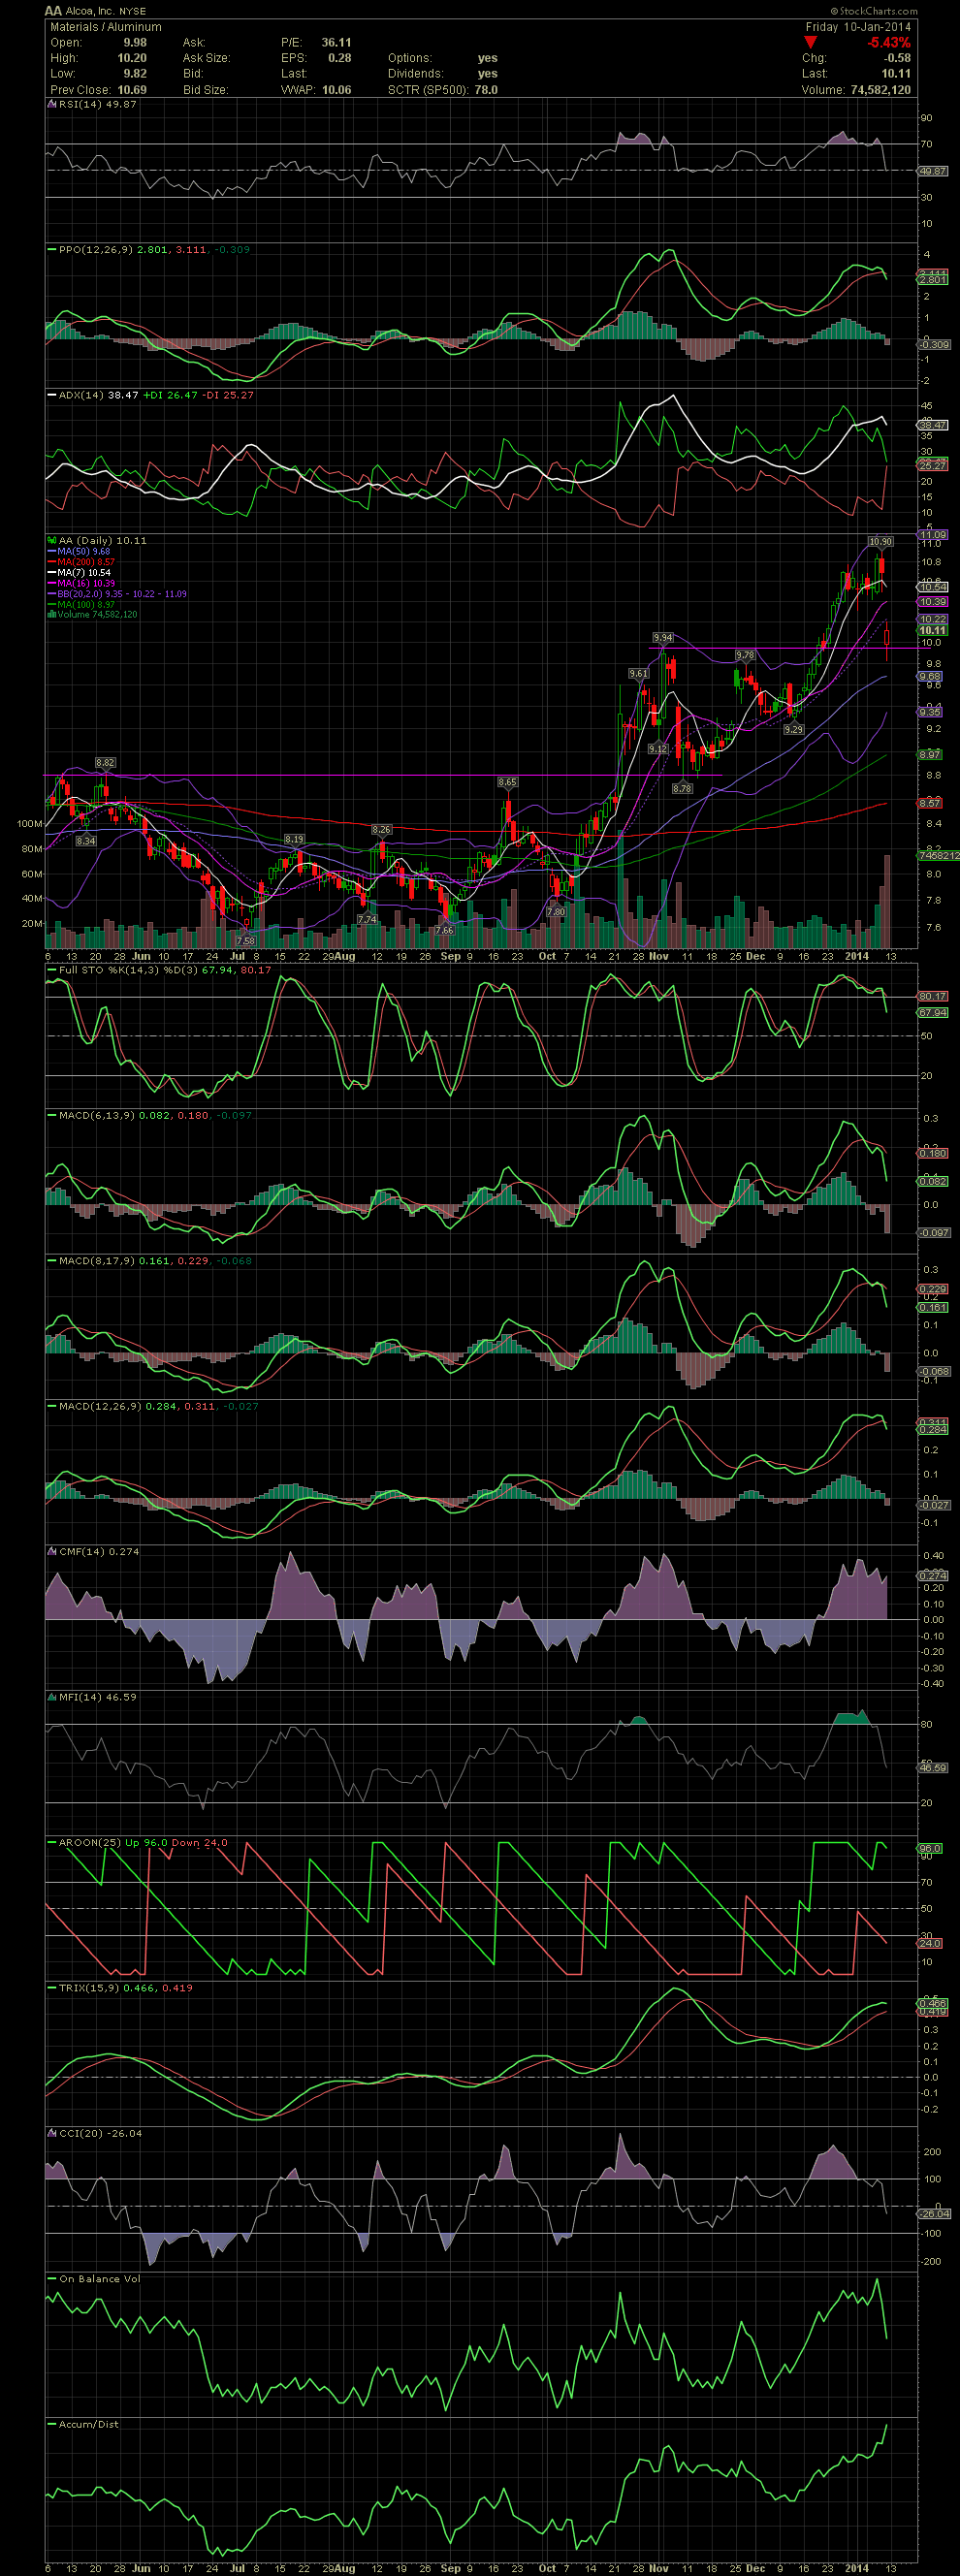
AA Daily Chart ~ Broke Down on Friday
Decided to sell AA one day after my last post on AA. Although it rallied to 10.90 after I sold it at 10.42, Friday saw a sharp drop after the company released its earnings report AH on Thursday. As I mentioned in my last AA post, I would excite if the stock gave me a sell signal. This swing trade was from entries at 8.62 for a gain of 20%. I'm now watching the previous high as some possible support at the 9.94 (link back to previous AA post). But with the FullSto and MACDs now having crossed over to the negative from fairly high levels, I'm not entering until they reset. Friday's decline saw the stock open at 9.98, dropping to under the 9.94 line, and rallying back to the MA20 before closing at 10.11. AA has been good to us for those using the more conservative funds, so we'll now wait for the chart to allow us a calculated re-enter. GLTA
My sell order of Jan 2:
| 01/02/14 | Sold | 1,000 of AA @ $10.4223 (Order #260) | 10,414.12 |


