Posted On: 01/10/2014 3:07:07 PM
Post# of 338555

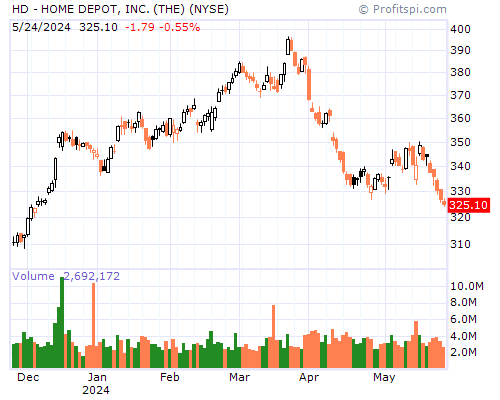
HD Stock Chart and Technical Analysis - Fri, Jan 10th, 2014 $HD
Period Moving Average Price Change Percent Change Average Volume
5 Day 81.58 -0.09 -0.11% 5,642,469
20 Day 80.79 +2.80 +3.54% 5,593,747
50 Day 79.41 +4.30 +5.55% 6,365,015
100 Day 77.35 +6.59 +8.76% 6,950,954
200 Day 76.88 +12.15 +17.44% 7,038,457
Year to Date 81.69 -0.54 -0.66% 5,195,035
Period Raw Stochastic Stochastic %K Stochastic %D Average True Range
9 Day 51.57% 50.77% 50.24% 0.87
14 Day 69.57% 73.47% 74.61% 0.93
20 Day 82.05% 81.27% 78.50% 0.98
50 Day 90.12% 89.69% 88.16% 1.09
100 Day 92.57% 92.25% 91.10% 1.13
Period Relative Strength Percent R Historic Volatility MACD Oscillator
9 Day 60.28% 48.43% 7.98% -0.02
14 Day 60.51% 30.43% 8.01% +0.30
20 Day 59.88% 17.95% 9.85% +0.98
50 Day 56.64% 9.88% 12.58% +2.35
100 Day 55.62% 7.43% 14.72% +4.41