Posted On: 01/07/2014 3:41:26 AM
Post# of 2561

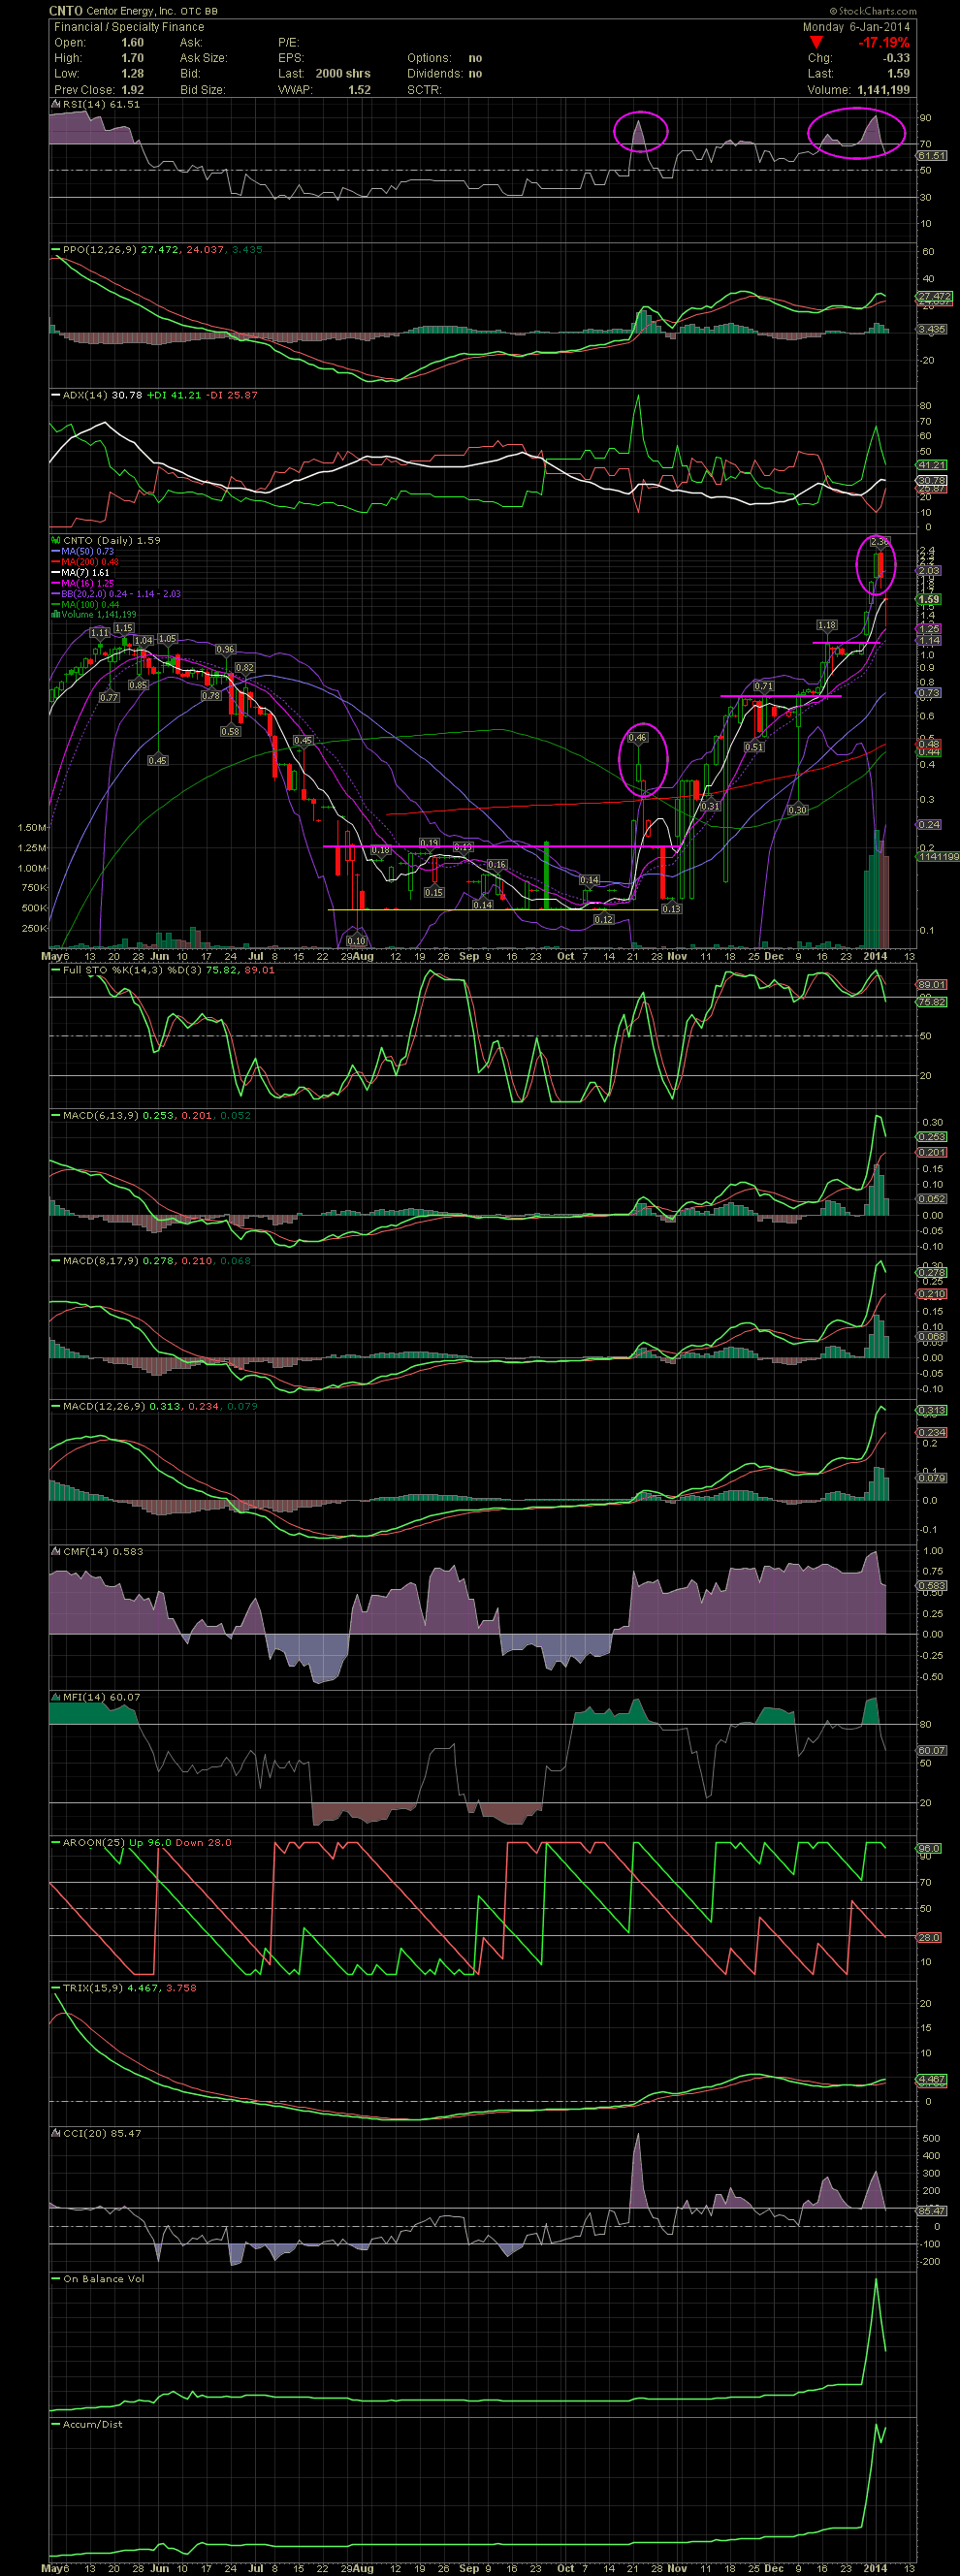
CNTO Daily Chart ~ A Strong Move Followed by a Sharp Pullback
I received a few requests for a chart on CNTO over the last three days. The stock had a tremendous move since the channel is was trading in from August to November. Since then, CNTO ran from .13 to as high as 2.36 with a few periods of sideways consolidation along the way. On Thursday the stock traded completely outside of the upper bollie, and for those following along here, know what that means, especially when the FullSto and MACDs are in very overbought territory. Add to that a RSI that was trading over 90, and the stock was setup for a pullback. As always, no one knows how far a stock will fall during a correction. It could be short, as was the case during the end of November, or a sideways move as in mid to late December, or a heavier drop as the stock is seeing now. In either case, it comes back to taking a few or all off the table when the candles begin trading way outside the upper bollie. And the expensive lessons occur when buying a stock when it is outside the upper bollie.
I received a few requests for a chart on CNTO over the last three days. The stock had a tremendous move since the channel is was trading in from August to November. Since then, CNTO ran from .13 to as high as 2.36 with a few periods of sideways consolidation along the way. On Thursday the stock traded completely outside of the upper bollie, and for those following along here, know what that means, especially when the FullSto and MACDs are in very overbought territory. Add to that a RSI that was trading over 90, and the stock was setup for a pullback. As always, no one knows how far a stock will fall during a correction. It could be short, as was the case during the end of November, or a sideways move as in mid to late December, or a heavier drop as the stock is seeing now. In either case, it comes back to taking a few or all off the table when the candles begin trading way outside the upper bollie. And the expensive lessons occur when buying a stock when it is outside the upper bollie.