Posted On: 01/06/2014 11:10:09 AM
Post# of 2561

DRYS Daily Chart ~ The Exits of Last Week Were Correct
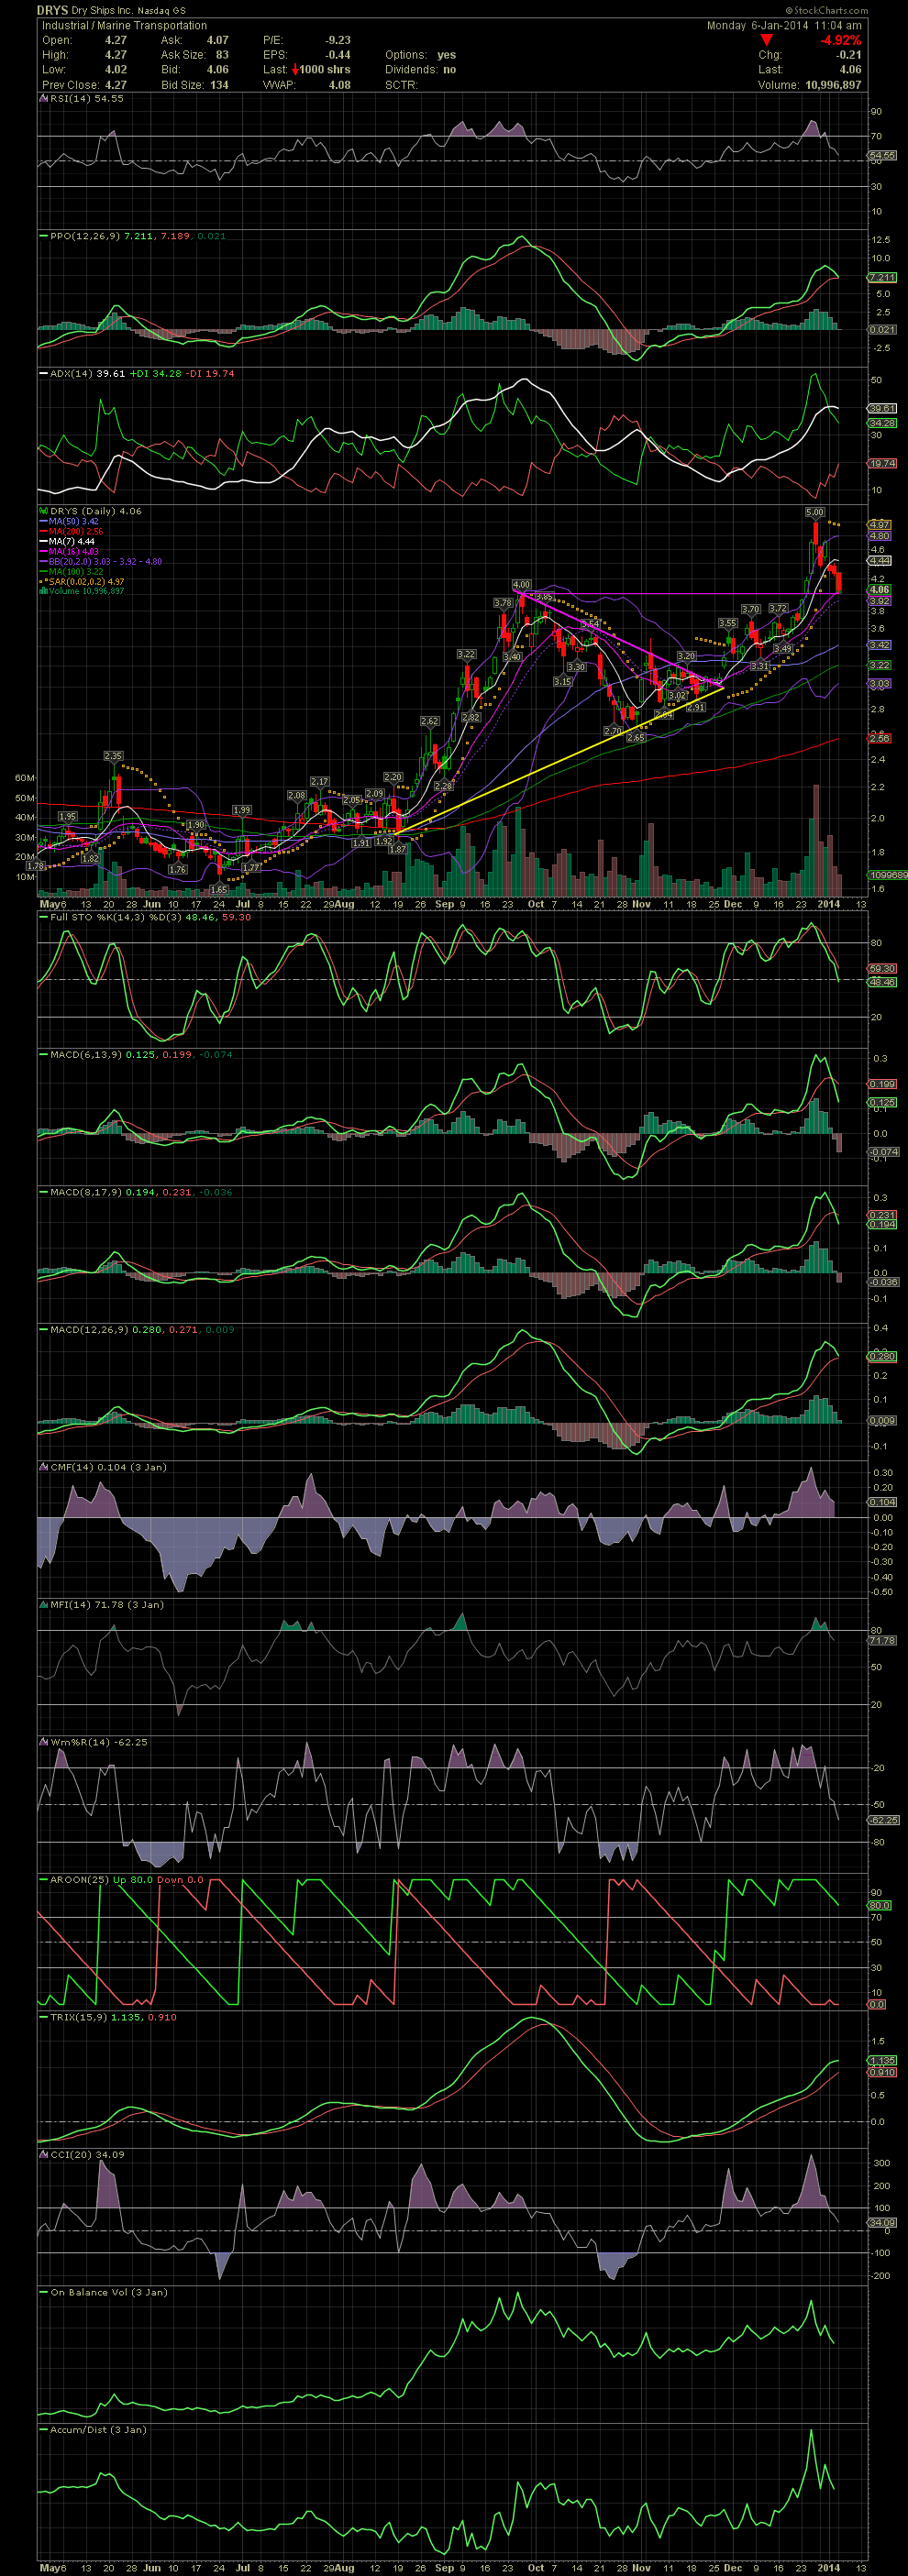
When the indicators begin to curl from overbought levels, you need to pay attention to them. DRYS has now fallen almost 20% over the last six days. Today the stock is testing the previous high of 4.00 as the preliminary potential support level. Just under that is the MA20. The FullSto and MACDs are crossing over to the negative, so now we'll just sit and wait for our next swing trade. Today was swing trade #3 from as low as the high 2.80s for a few up to 3.40s for others. Nice trading! GLTA

When the indicators begin to curl from overbought levels, you need to pay attention to them. DRYS has now fallen almost 20% over the last six days. Today the stock is testing the previous high of 4.00 as the preliminary potential support level. Just under that is the MA20. The FullSto and MACDs are crossing over to the negative, so now we'll just sit and wait for our next swing trade. Today was swing trade #3 from as low as the high 2.80s for a few up to 3.40s for others. Nice trading! GLTA

