Posted On: 01/05/2014 12:03:50 PM
Post# of 2561

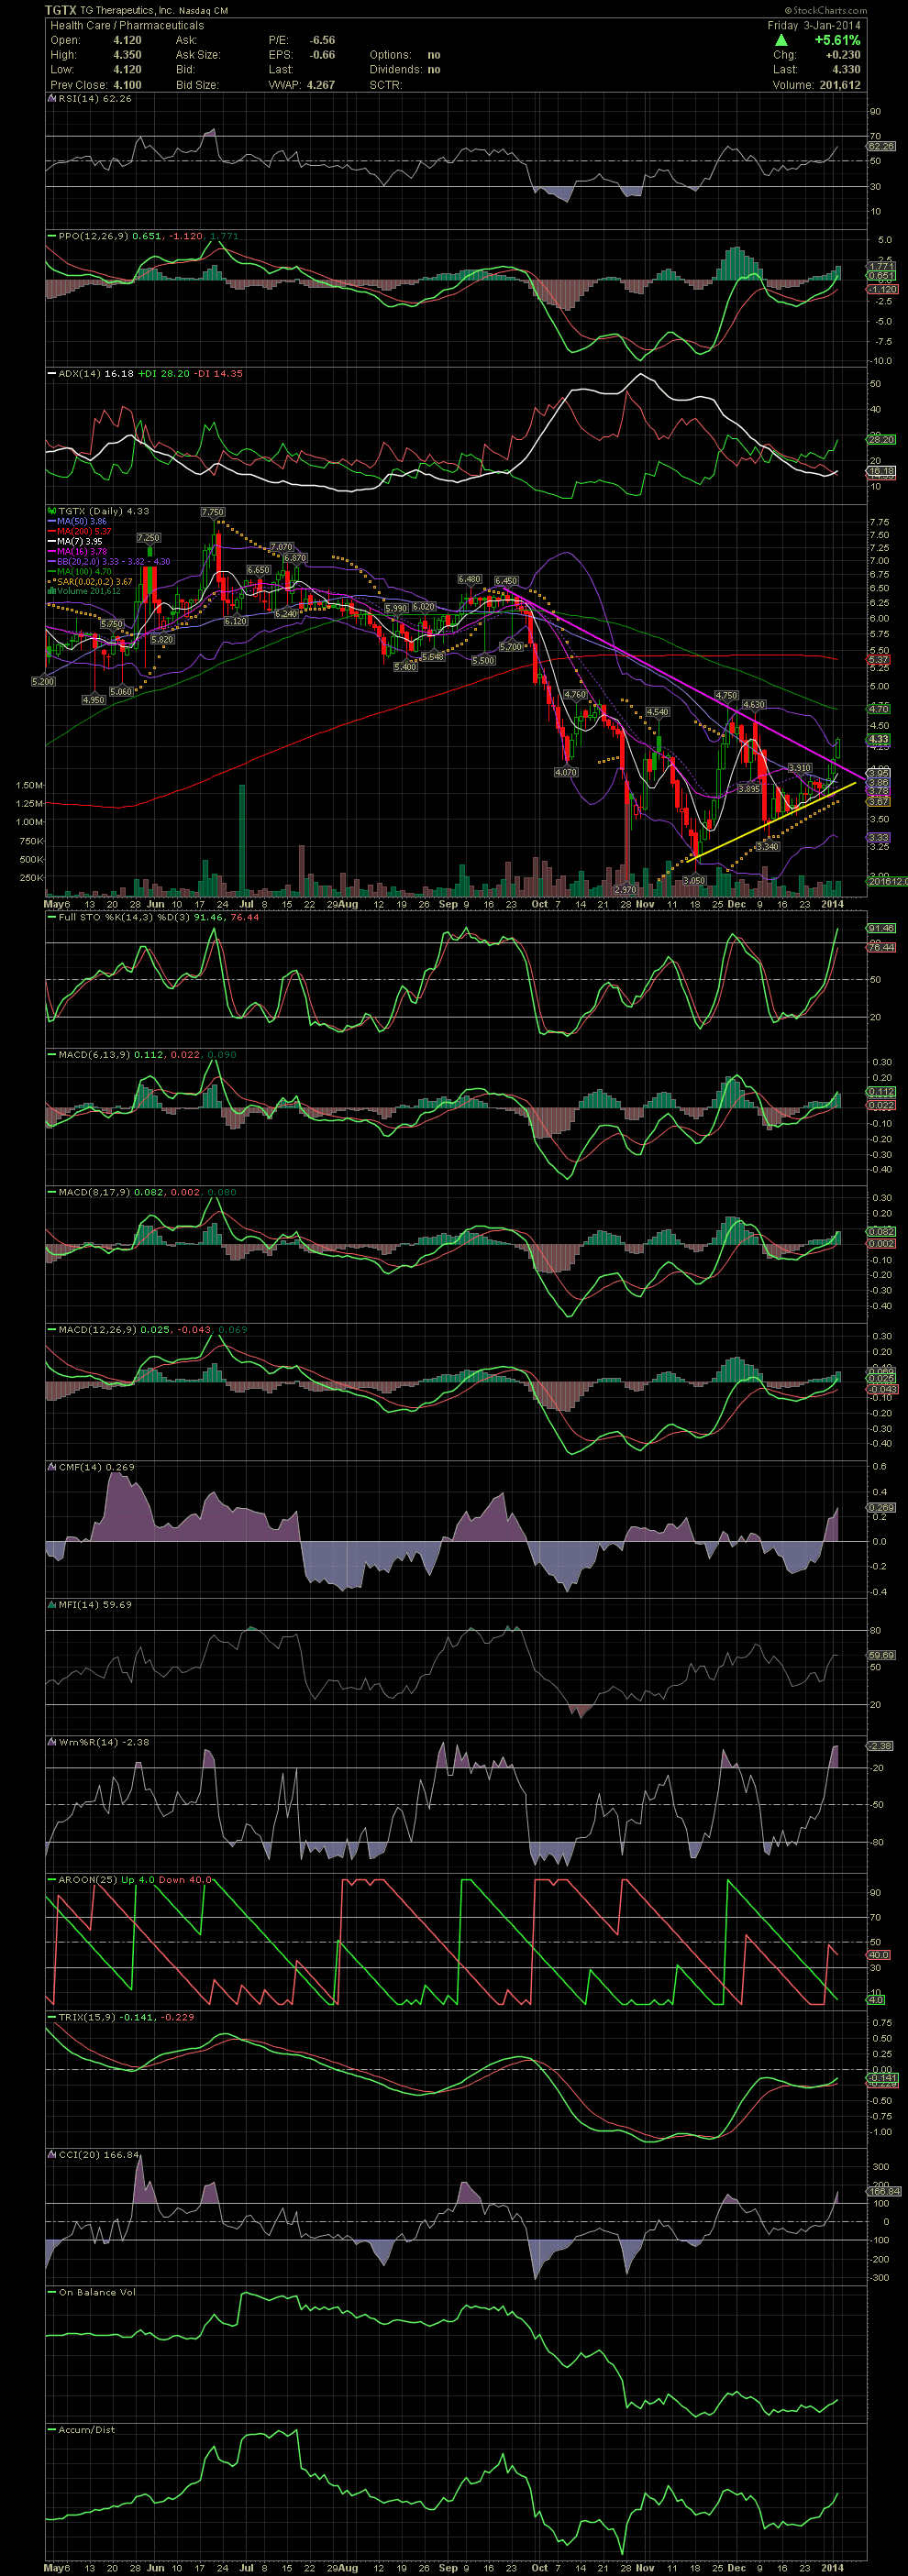
TGTX Daily Chart ~ Another Breakout Underway
As with many other stocks with similar chart patterns, TGTX has broken to the upside after clearing the multi month, declining tops line while having ridden a rising support line for weeks. My first mention of TGTX was on Thursday prior to Friday's 5.61% move higher. I should have invested in this one back in mid December when I first began to follow the stock. But there's only so many one can buy. The stock is up almost 25% since then, and that's not bad for a three week period. Again, I'd love to compound my returns at 25% every 3 weeks, lol. If you are in TGTX or contemplating an investment, I would be looking at the 4.63/4.75 previous highs, along with the MA100 and 200 at 4.70 and 5.37, as possible resistance level. The mid 6.00s is very possible on a technical basis. GLTA
As with many other stocks with similar chart patterns, TGTX has broken to the upside after clearing the multi month, declining tops line while having ridden a rising support line for weeks. My first mention of TGTX was on Thursday prior to Friday's 5.61% move higher. I should have invested in this one back in mid December when I first began to follow the stock. But there's only so many one can buy. The stock is up almost 25% since then, and that's not bad for a three week period. Again, I'd love to compound my returns at 25% every 3 weeks, lol. If you are in TGTX or contemplating an investment, I would be looking at the 4.63/4.75 previous highs, along with the MA100 and 200 at 4.70 and 5.37, as possible resistance level. The mid 6.00s is very possible on a technical basis. GLTA