Posted On: 01/05/2014 11:44:18 AM
Post# of 2561

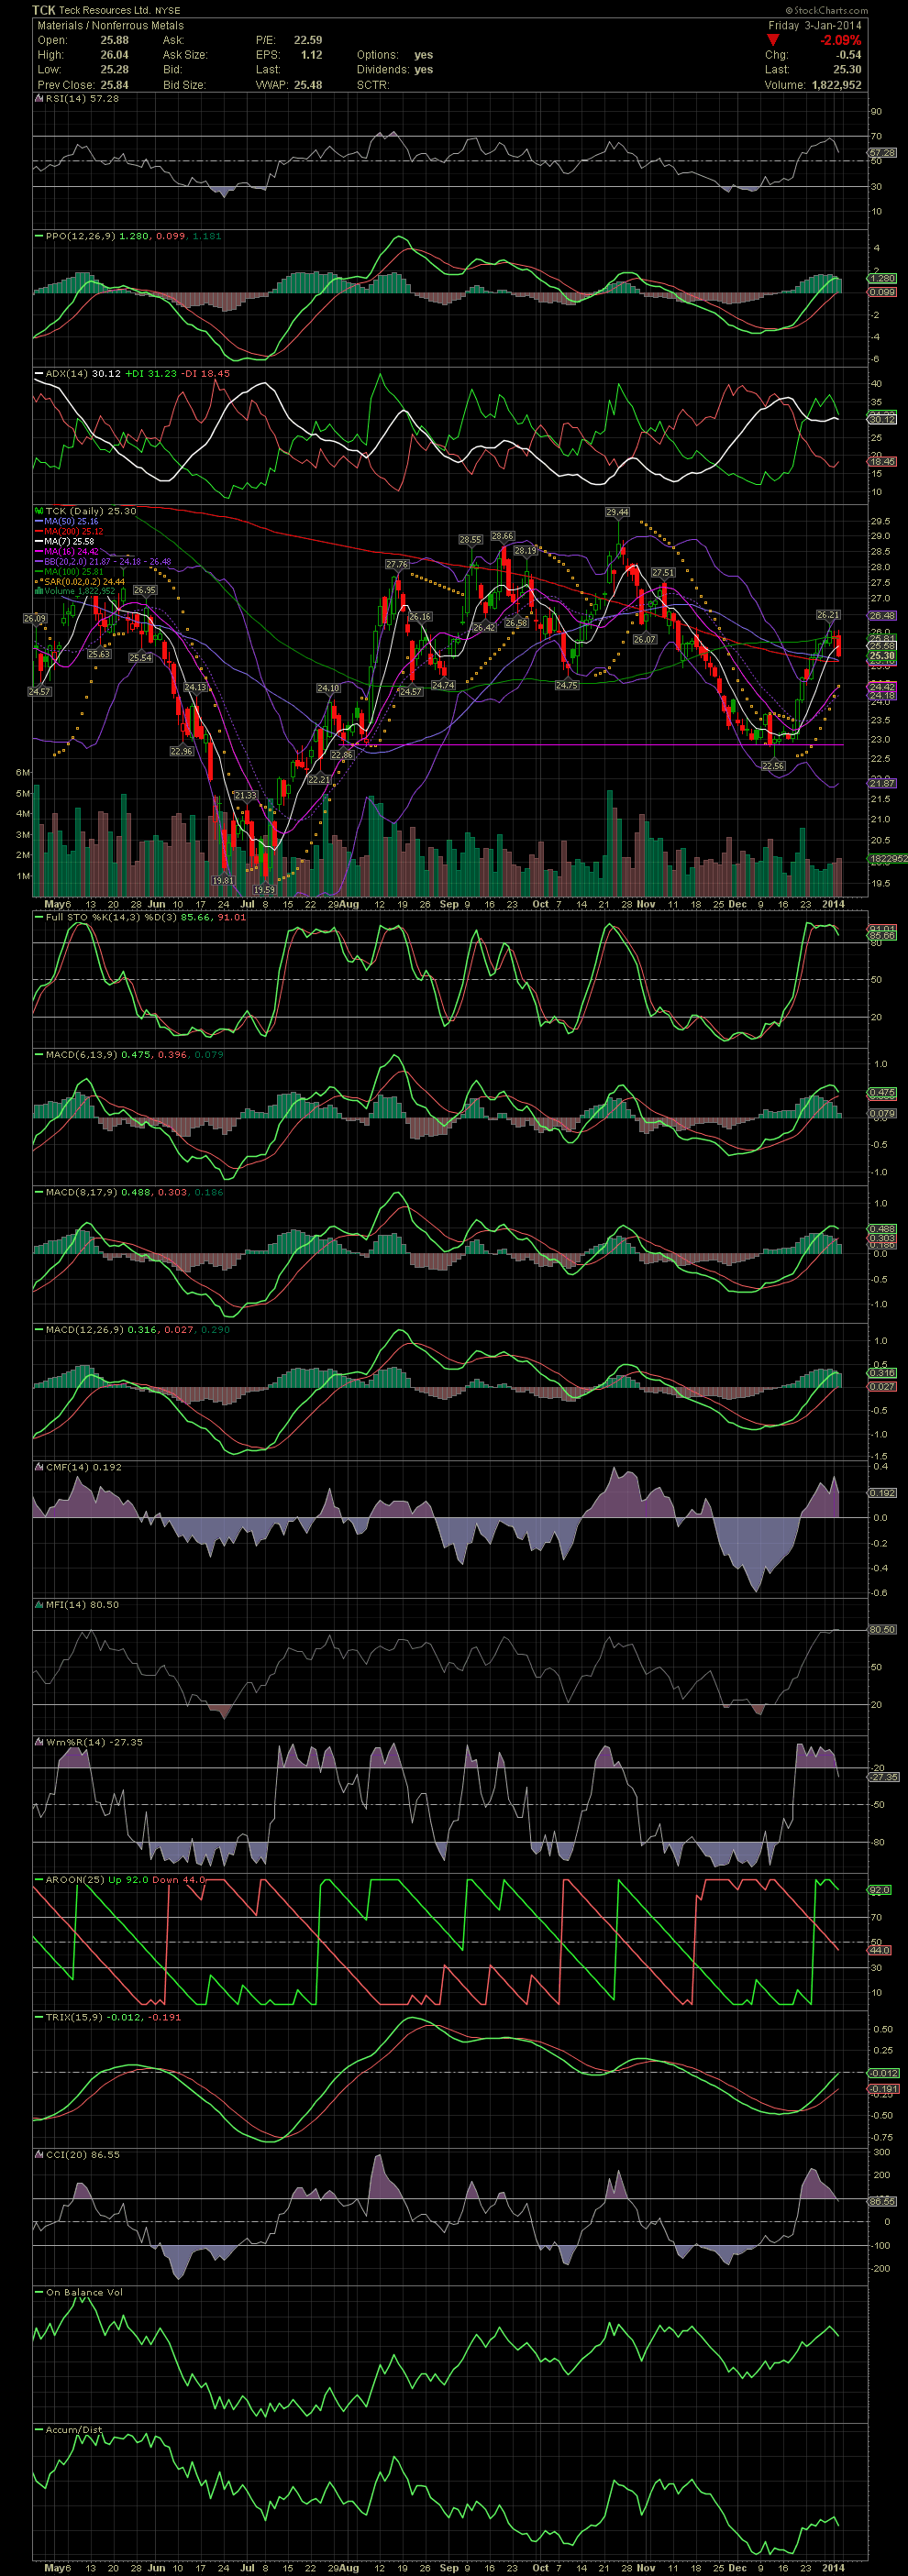
TCK Daily Chart ~ Stock Weakens After Failing to Hold the MA100
If you are in TCK, keep your eyes on the MA50 and 200. A break below those would probably signal that TCK will fall to the middle bollie (aka the MA20). I'm not liking the increased selling volume of the last two days, so I'll not be hanging on long should the stock break the 25.10 level, just under the MA50/200. I'd rather lock in a three week gain of 9% at 25.10 than be looking or hoping that the stock will reverse a downtrend. The 26.21 of three days ago is looking better every hour, lol. GTLA
If you are in TCK, keep your eyes on the MA50 and 200. A break below those would probably signal that TCK will fall to the middle bollie (aka the MA20). I'm not liking the increased selling volume of the last two days, so I'll not be hanging on long should the stock break the 25.10 level, just under the MA50/200. I'd rather lock in a three week gain of 9% at 25.10 than be looking or hoping that the stock will reverse a downtrend. The 26.21 of three days ago is looking better every hour, lol. GTLA