Posted On: 01/05/2014 10:38:19 AM
Post# of 2561
PGNX Daily Chart ~ Back Inside the Upper Bollie
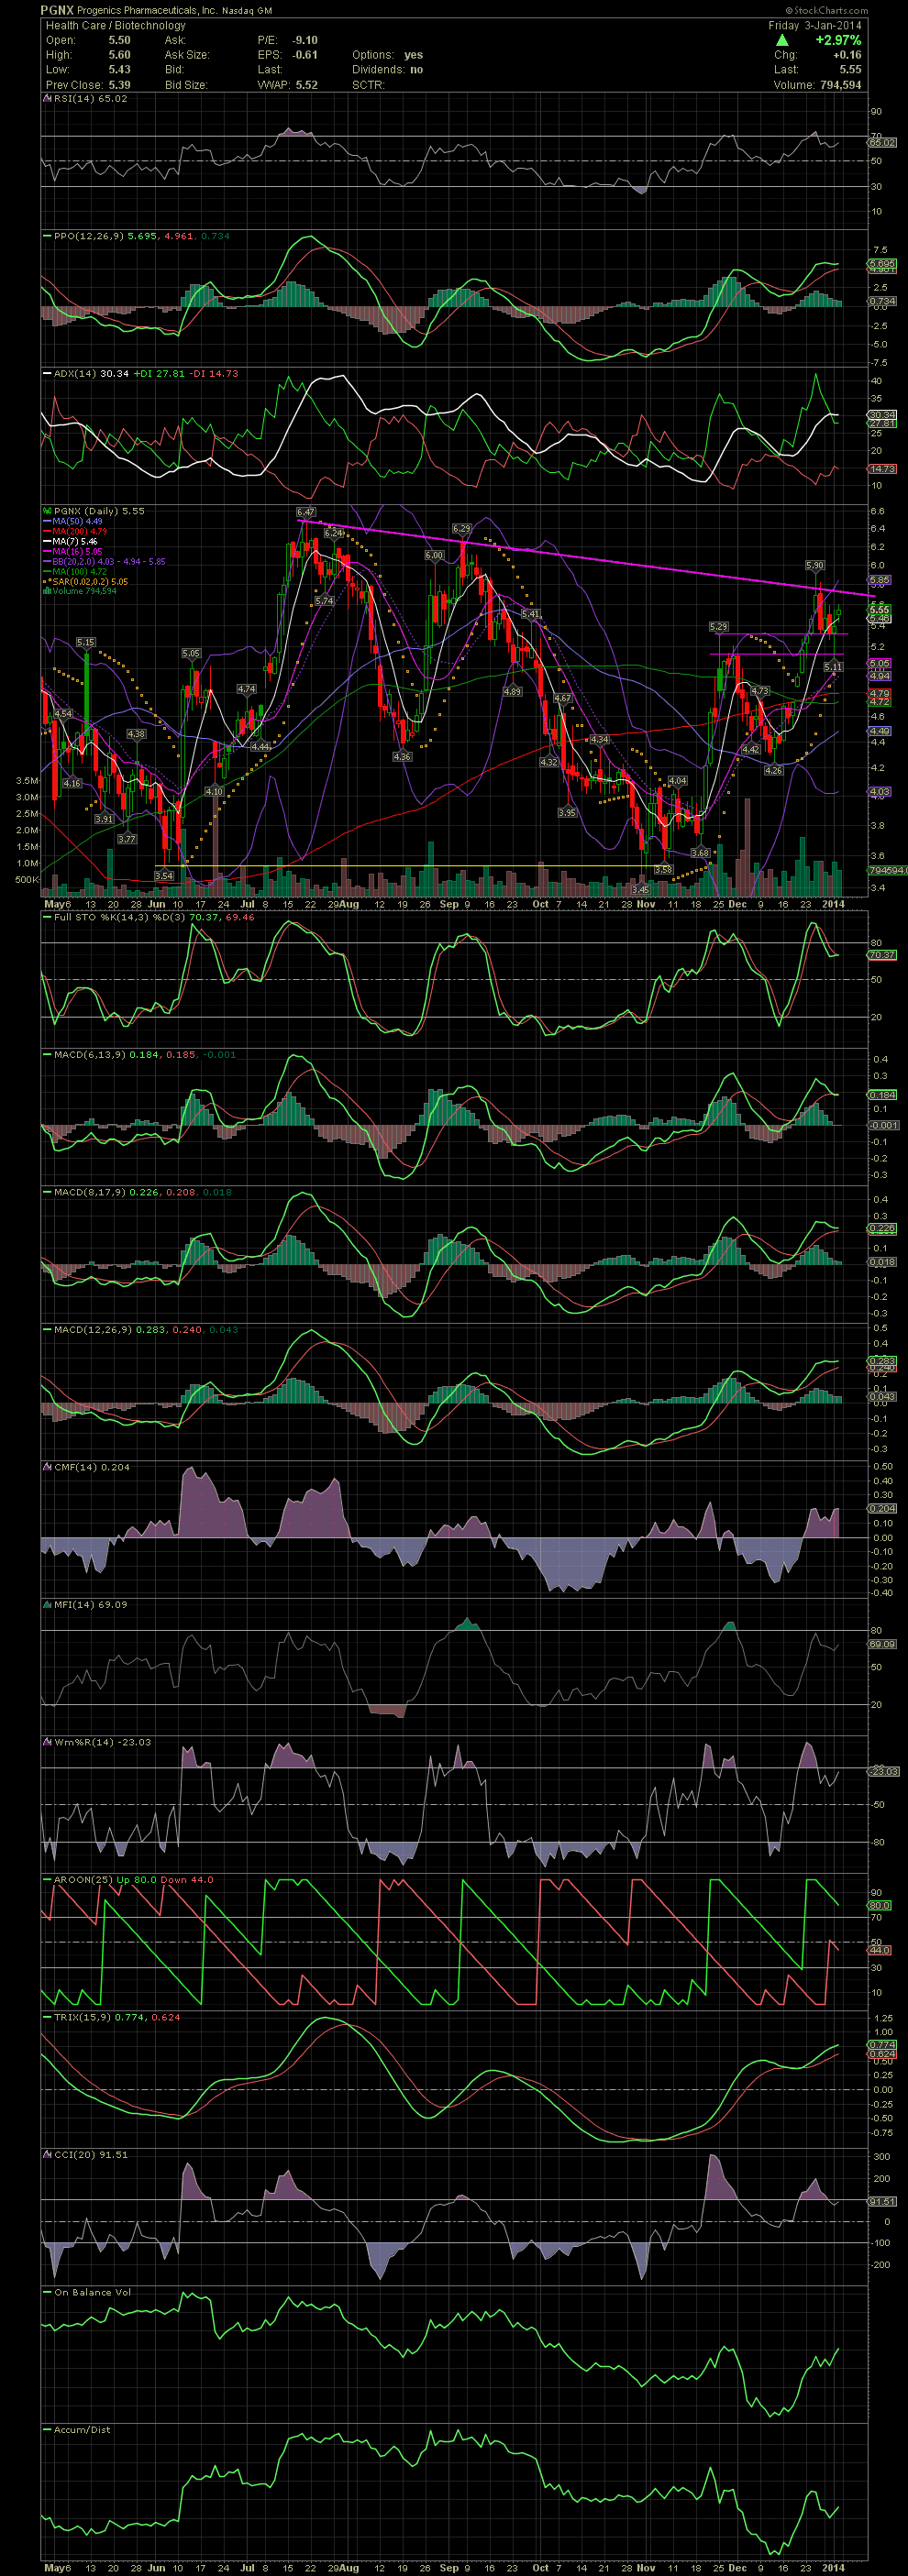
Link back to my last chart post on PGNX. As almost always, taking a few off above the upper bollie, when a candle is completely outside it, is a good trade. In the case of PGNX, a quick look at the chart shows that the stock began to return inside the upper bollie on the very next day after it hit 5.90. Support was found at the previous high of 5.29 and on an intraday dip the next day at the previous high in the 5.10s before recovering to the mid 5.50s. So, if selling a few when completely outside the upper bollie, and re-entering on the pullback makes sense, then why don't I do it every time? Greed at the highs is all I can attribute it too. I haven't become disciplined enough to trade totally emotionless yet. Working on that, lol. Anyway, I am now looking for PGNX to continue on the next leg up and break the declining tops line. When that happens, a test of the previous two highs of 6.29 and 6.47 will be the target. GLTA

Link back to my last chart post on PGNX. As almost always, taking a few off above the upper bollie, when a candle is completely outside it, is a good trade. In the case of PGNX, a quick look at the chart shows that the stock began to return inside the upper bollie on the very next day after it hit 5.90. Support was found at the previous high of 5.29 and on an intraday dip the next day at the previous high in the 5.10s before recovering to the mid 5.50s. So, if selling a few when completely outside the upper bollie, and re-entering on the pullback makes sense, then why don't I do it every time? Greed at the highs is all I can attribute it too. I haven't become disciplined enough to trade totally emotionless yet. Working on that, lol. Anyway, I am now looking for PGNX to continue on the next leg up and break the declining tops line. When that happens, a test of the previous two highs of 6.29 and 6.47 will be the target. GLTA


