Posted On: 01/02/2014 3:01:24 AM
Post# of 1187

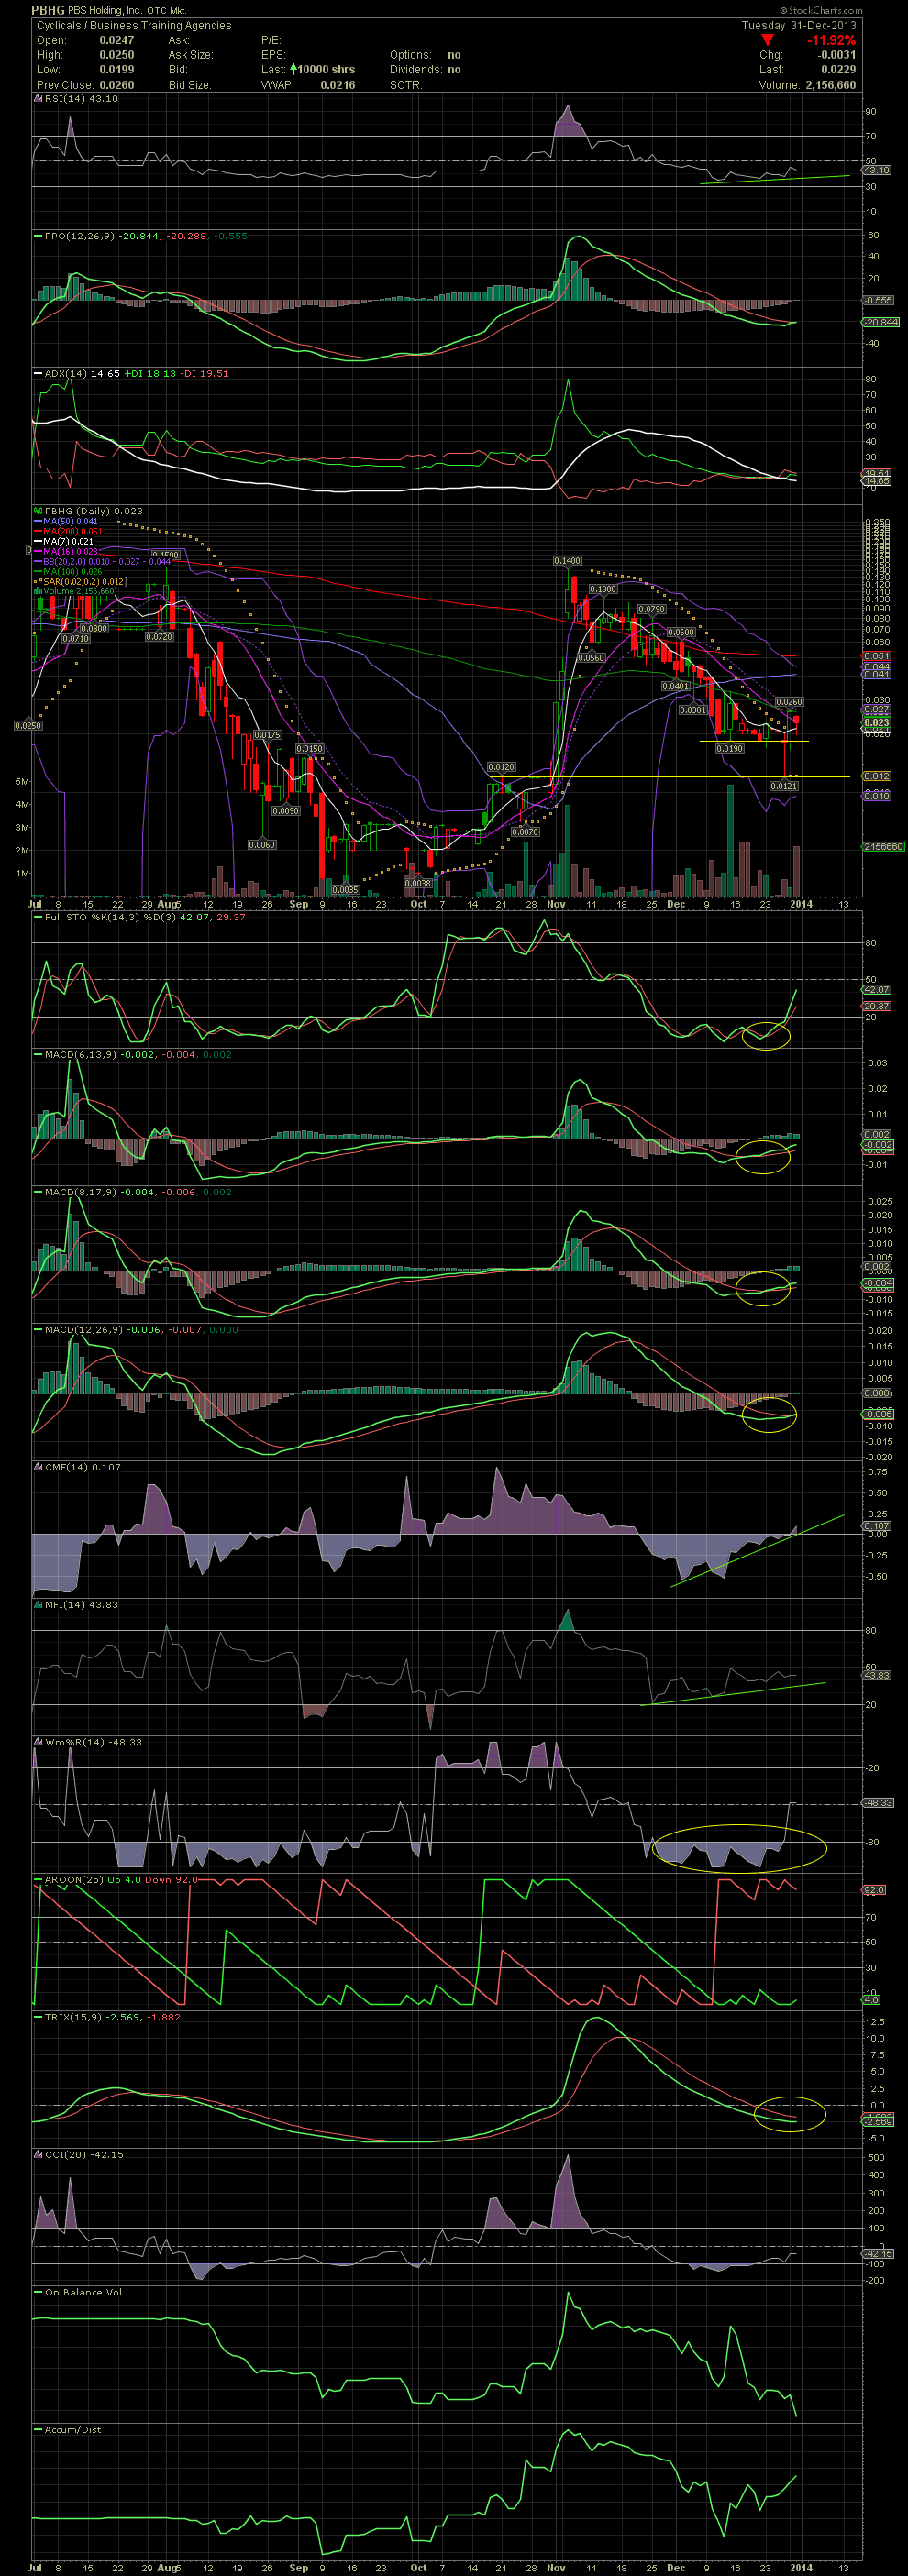
PBHG Daily Chart ~ Bottom In?
Nice support over the last three weeks near the .019 level while the FullSto and MACDs began their positive crossovers. Could the bottom have been put in? I'm guessing yes, and I've been accumulating in the high .01s to .025 recently. I would like to see at least 2-3 days green days, with volume, and the share price recapturing the MA10, 16 and 20 immediately ahead. That would confirm a buy signal for me. I was asked about the Golden Cross shaping up. That is when the MA50 crosses above the MA200. Many people talk about the Golden Cross, but if that's what you are waiting for, you'll be paying much more than .02s. It's a lagging indicator and will take a much higher share price to trigger it. In the meantime, most of the indicators are beginning to show some green times might be upon us. GLTA

Nice support over the last three weeks near the .019 level while the FullSto and MACDs began their positive crossovers. Could the bottom have been put in? I'm guessing yes, and I've been accumulating in the high .01s to .025 recently. I would like to see at least 2-3 days green days, with volume, and the share price recapturing the MA10, 16 and 20 immediately ahead. That would confirm a buy signal for me. I was asked about the Golden Cross shaping up. That is when the MA50 crosses above the MA200. Many people talk about the Golden Cross, but if that's what you are waiting for, you'll be paying much more than .02s. It's a lagging indicator and will take a much higher share price to trigger it. In the meantime, most of the indicators are beginning to show some green times might be upon us. GLTA

