Posted On: 01/01/2014 9:36:31 PM
Post# of 2561

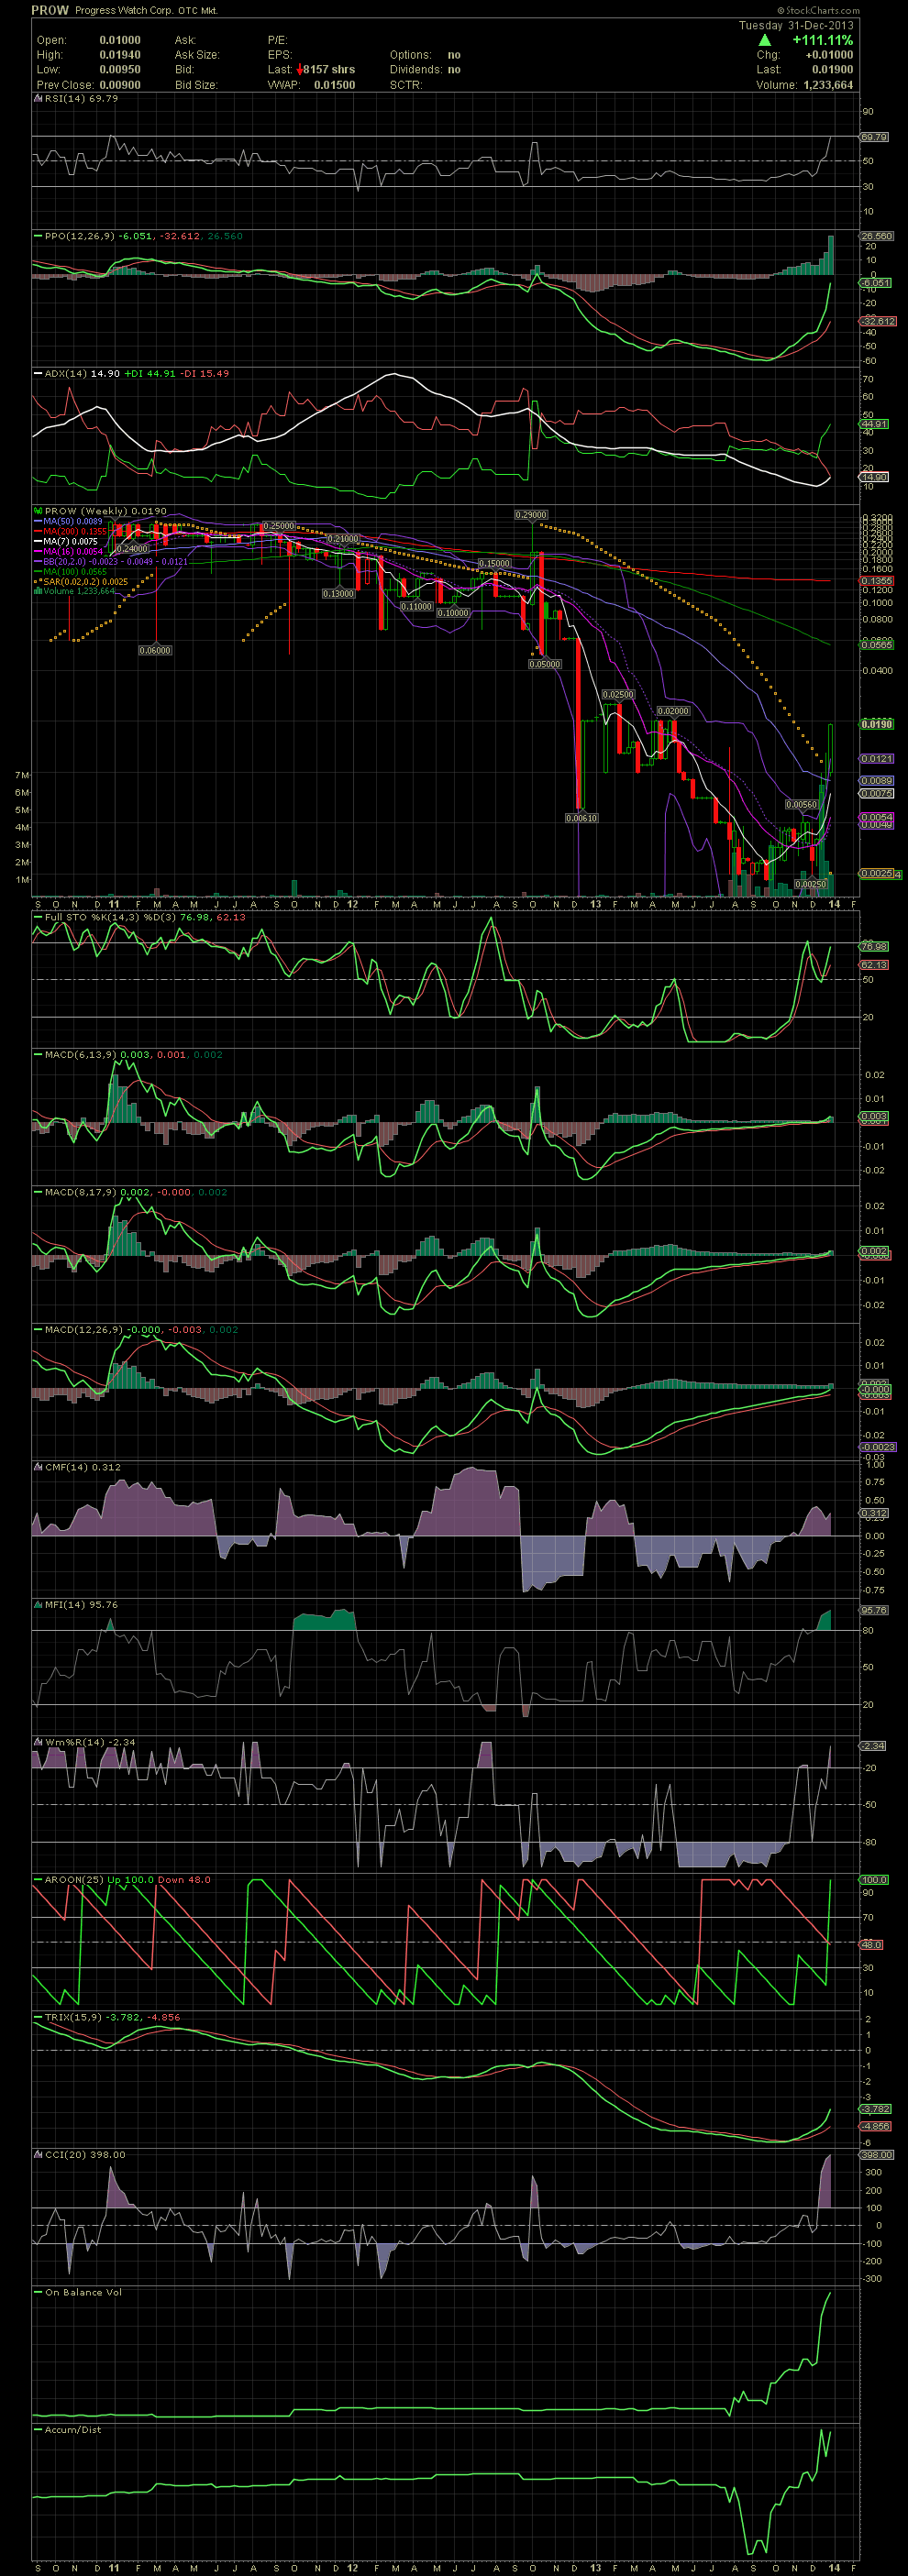
PROW Weekly Chart ~ The Bigger View of Things
This is why one needs to look at all chart available when initially begin to consider a stock. Had I looked at the weekly chart when a couple of friends told me about PROW, I would have seen that this stock had already bottomed in November. There is some horizontal resistance at .02 and .025 as can be seen with the two previous highs of April and January of 2013. We clear those two points, and PROW could be off to the races as in getting to the MA100 and MA200. The Weekly shows the volume surge as someone began to accumulate at the bottom. GLTA
This is why one needs to look at all chart available when initially begin to consider a stock. Had I looked at the weekly chart when a couple of friends told me about PROW, I would have seen that this stock had already bottomed in November. There is some horizontal resistance at .02 and .025 as can be seen with the two previous highs of April and January of 2013. We clear those two points, and PROW could be off to the races as in getting to the MA100 and MA200. The Weekly shows the volume surge as someone began to accumulate at the bottom. GLTA