Posted On: 12/30/2013 11:41:43 PM
Post# of 1187

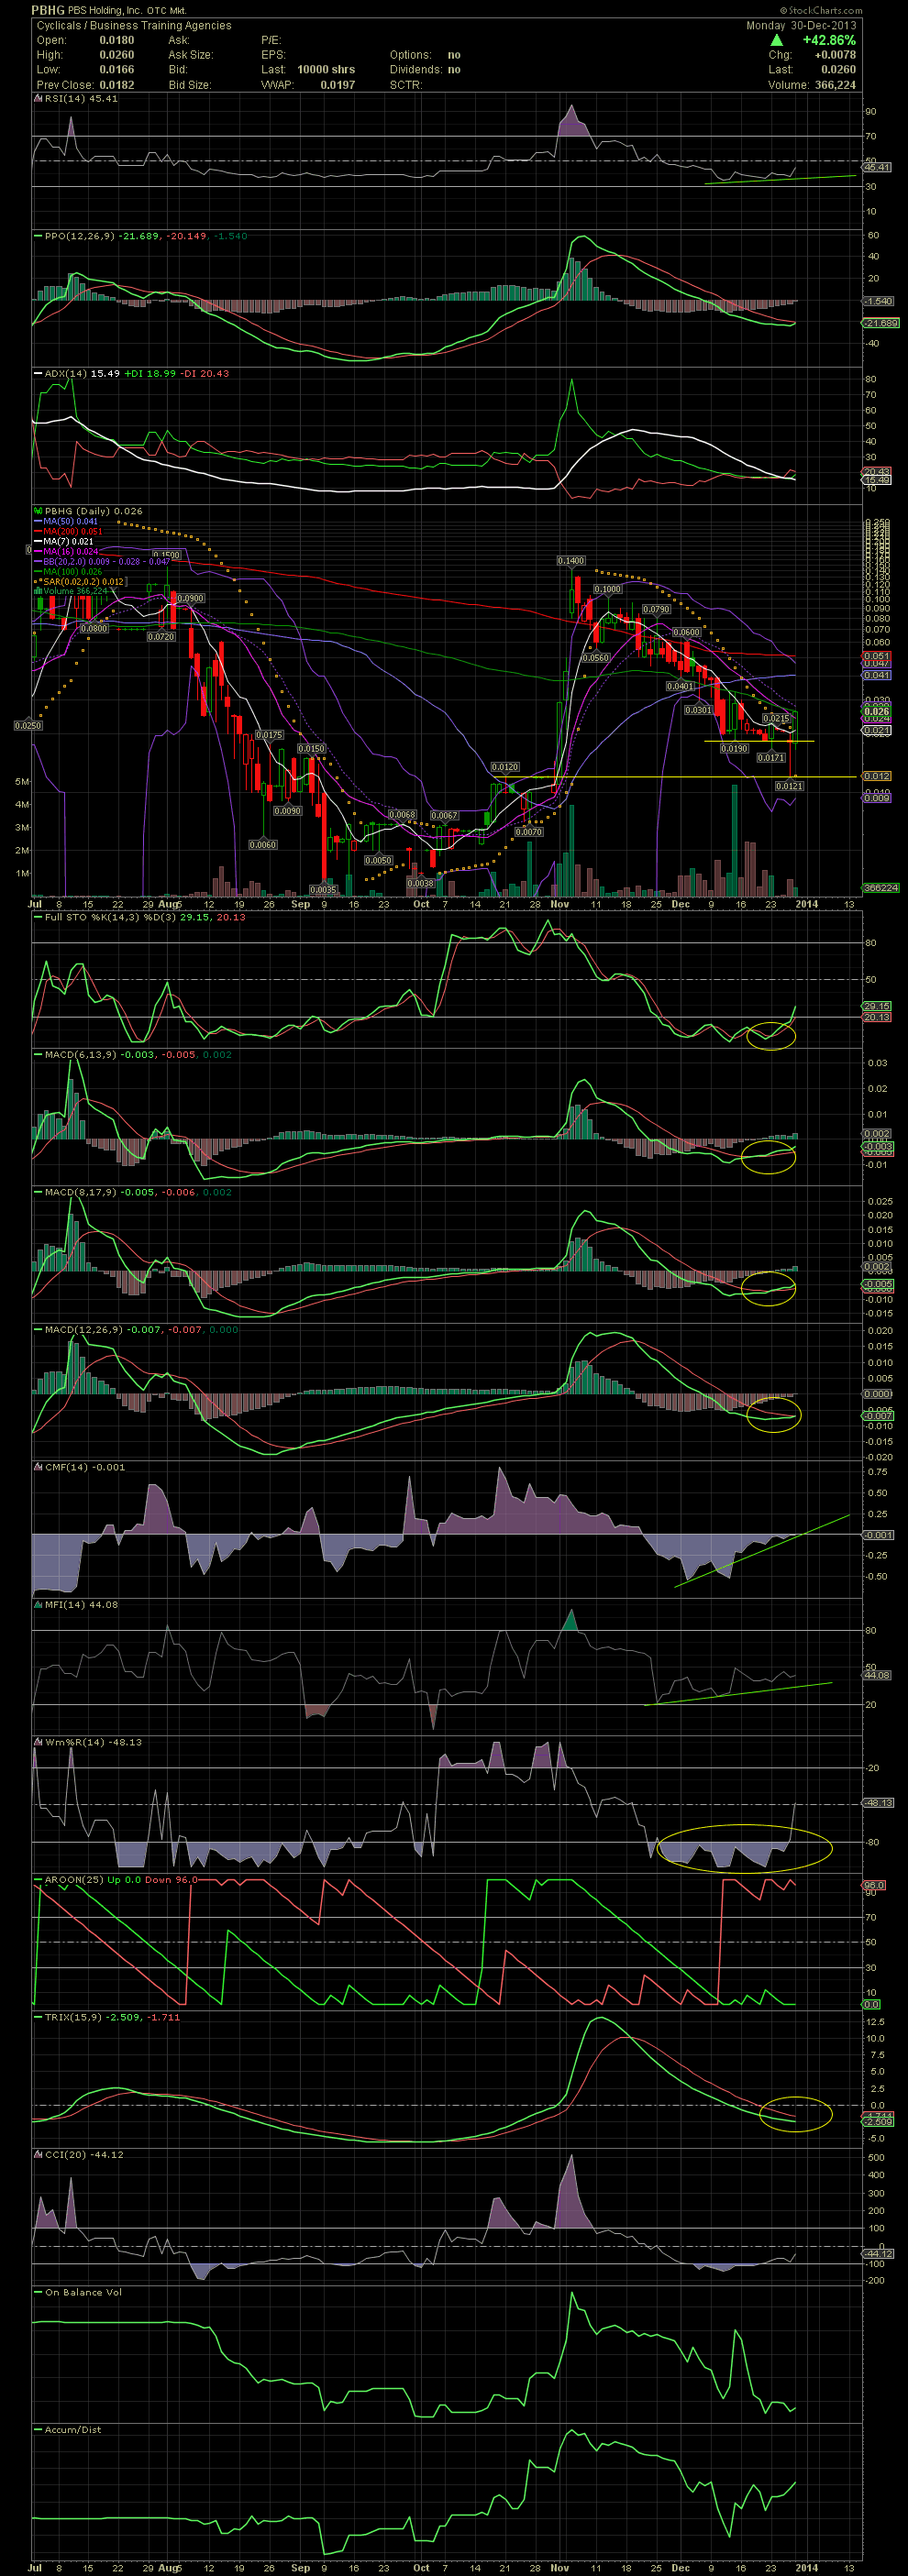
PBHG Daily Chart ~ FullSto and MACDs Crossing to the Positive
Although not a chart play to me, PBHG's chart is showing an imminent move began today. Let's see if we get any follow through buying tomorrow. A good looking chart will help to bring in traders. The stock closed on the MA100. The MA20 (aka middle bollie) is at .028. Recapturing that one will be key for many technical traders who are waiting for a reversal confirmation before they buy. A bit further above is the always important MA50, also a biggie, and the MA200 is at .051. A close of .052 with volume should trigger a few alerts. A lot of important moving averages are now easily within reach. Check out the FullSto and MACDs with the positive crossovers to the upside. I annotated the indicators on late Thursday night so those who don't know what they represent can follow along and watch as the things develop. And as Highflier noted, most of the tax loss selling is now exhausted. Finally, please note the horizontal support lines that I've drawn on the chart a couple of weeks ago. The .018/.019 level held fairly well. A second or third green day would confirm the reversal has started. GLTA
Although not a chart play to me, PBHG's chart is showing an imminent move began today. Let's see if we get any follow through buying tomorrow. A good looking chart will help to bring in traders. The stock closed on the MA100. The MA20 (aka middle bollie) is at .028. Recapturing that one will be key for many technical traders who are waiting for a reversal confirmation before they buy. A bit further above is the always important MA50, also a biggie, and the MA200 is at .051. A close of .052 with volume should trigger a few alerts. A lot of important moving averages are now easily within reach. Check out the FullSto and MACDs with the positive crossovers to the upside. I annotated the indicators on late Thursday night so those who don't know what they represent can follow along and watch as the things develop. And as Highflier noted, most of the tax loss selling is now exhausted. Finally, please note the horizontal support lines that I've drawn on the chart a couple of weeks ago. The .018/.019 level held fairly well. A second or third green day would confirm the reversal has started. GLTA