Posted On: 12/25/2013 11:00:04 PM
Post# of 2561

AA Weekly Chart ~ Worth a Look at the Big Picture
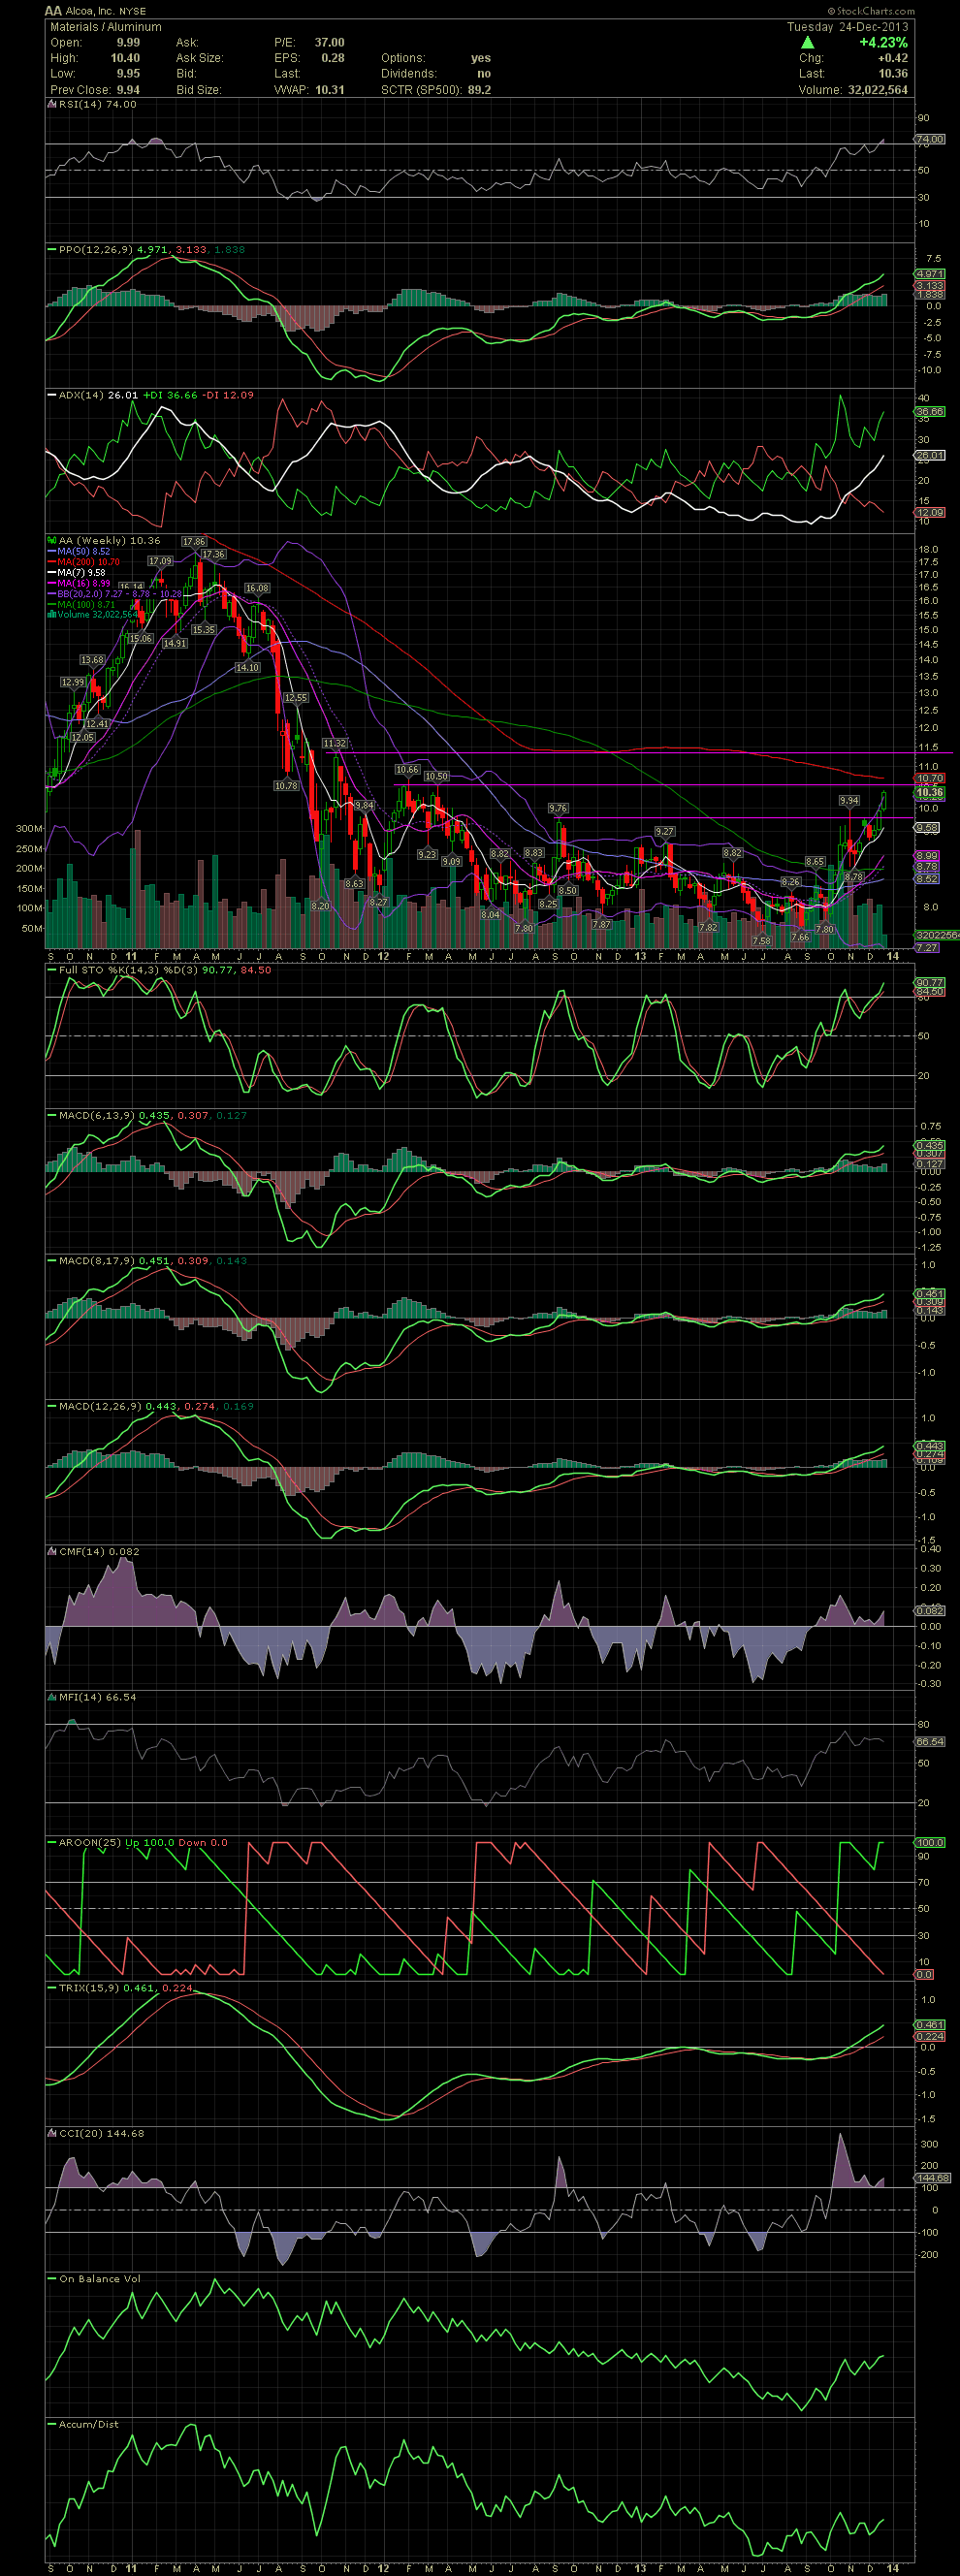
I've posted the AA Weekly Chart a few times so you can see the potential of a longer term investment in AA based on the technicals. It's getting a little more interesting now as AA continues to break through its previous tops, from 8.65, 8.82, 9.27, 9.76, and the last high of 9.94. Next up would be 10.50, 10.66 and 11.32. Should AA accomplish that, then we'll begin thinking about the possibilities of the high 17.00s to 20.00. Looking good. GLTA
I've posted the AA Weekly Chart a few times so you can see the potential of a longer term investment in AA based on the technicals. It's getting a little more interesting now as AA continues to break through its previous tops, from 8.65, 8.82, 9.27, 9.76, and the last high of 9.94. Next up would be 10.50, 10.66 and 11.32. Should AA accomplish that, then we'll begin thinking about the possibilities of the high 17.00s to 20.00. Looking good. GLTA