Posted On: 12/24/2013 1:26:49 AM
Post# of 4425

TDEY Weekly Chart ~ On the Rising Support Line
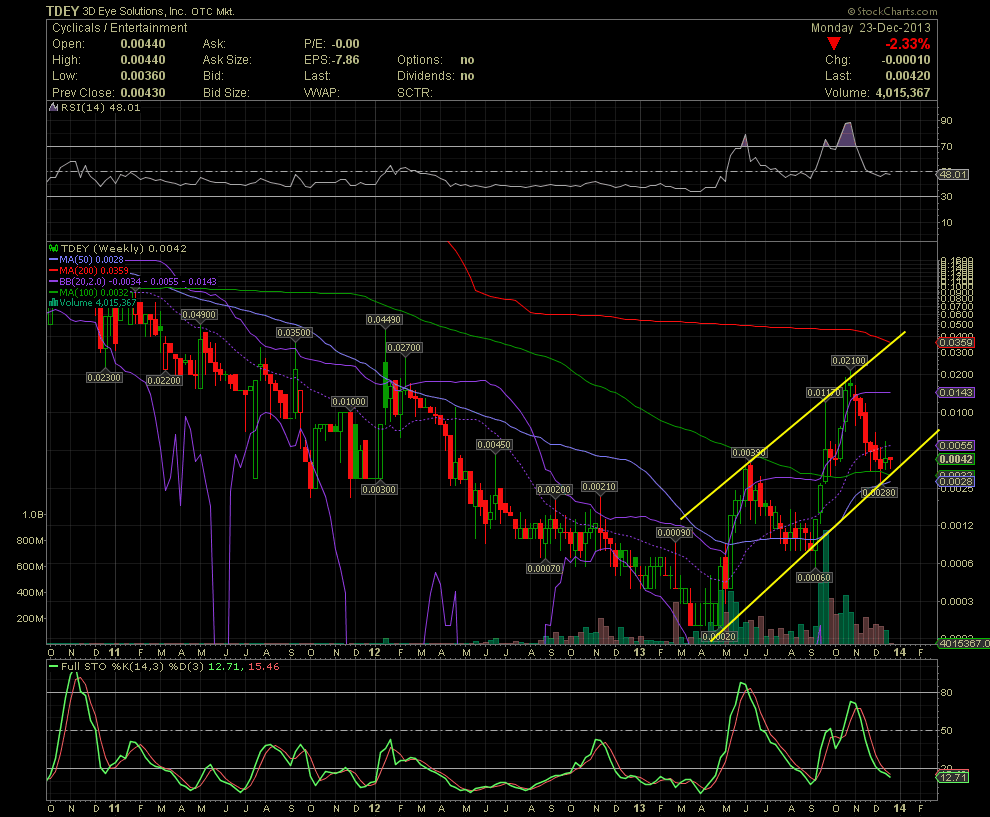
Here's a look at the TDEY Weekly Chart. Obviously, the stock has been in a sharp decline for weeks. Over the last two weeks, the decline has come to an end, and the stock is experiencing higher lows since .0028 was hit 1.5 weeks ago. As you can see, the first leg began at .0002 and ran to .0039. The subsequent correction took the stock to a low of .0006. The second leg witnessed a move to .021. Since then the stock has fallen to a low of .0028, and now has risen to .0042 while attempting to hold the rising channel. If the trading pattern holds, then TDEY should begin to rise as early shortly. Should the stock follow its recent trading history, then a move to .06/.07 over the next couple of months could be seen. GLTA

Here's a look at the TDEY Weekly Chart. Obviously, the stock has been in a sharp decline for weeks. Over the last two weeks, the decline has come to an end, and the stock is experiencing higher lows since .0028 was hit 1.5 weeks ago. As you can see, the first leg began at .0002 and ran to .0039. The subsequent correction took the stock to a low of .0006. The second leg witnessed a move to .021. Since then the stock has fallen to a low of .0028, and now has risen to .0042 while attempting to hold the rising channel. If the trading pattern holds, then TDEY should begin to rise as early shortly. Should the stock follow its recent trading history, then a move to .06/.07 over the next couple of months could be seen. GLTA

