Posted On: 12/22/2013 11:18:02 PM
Post# of 2561

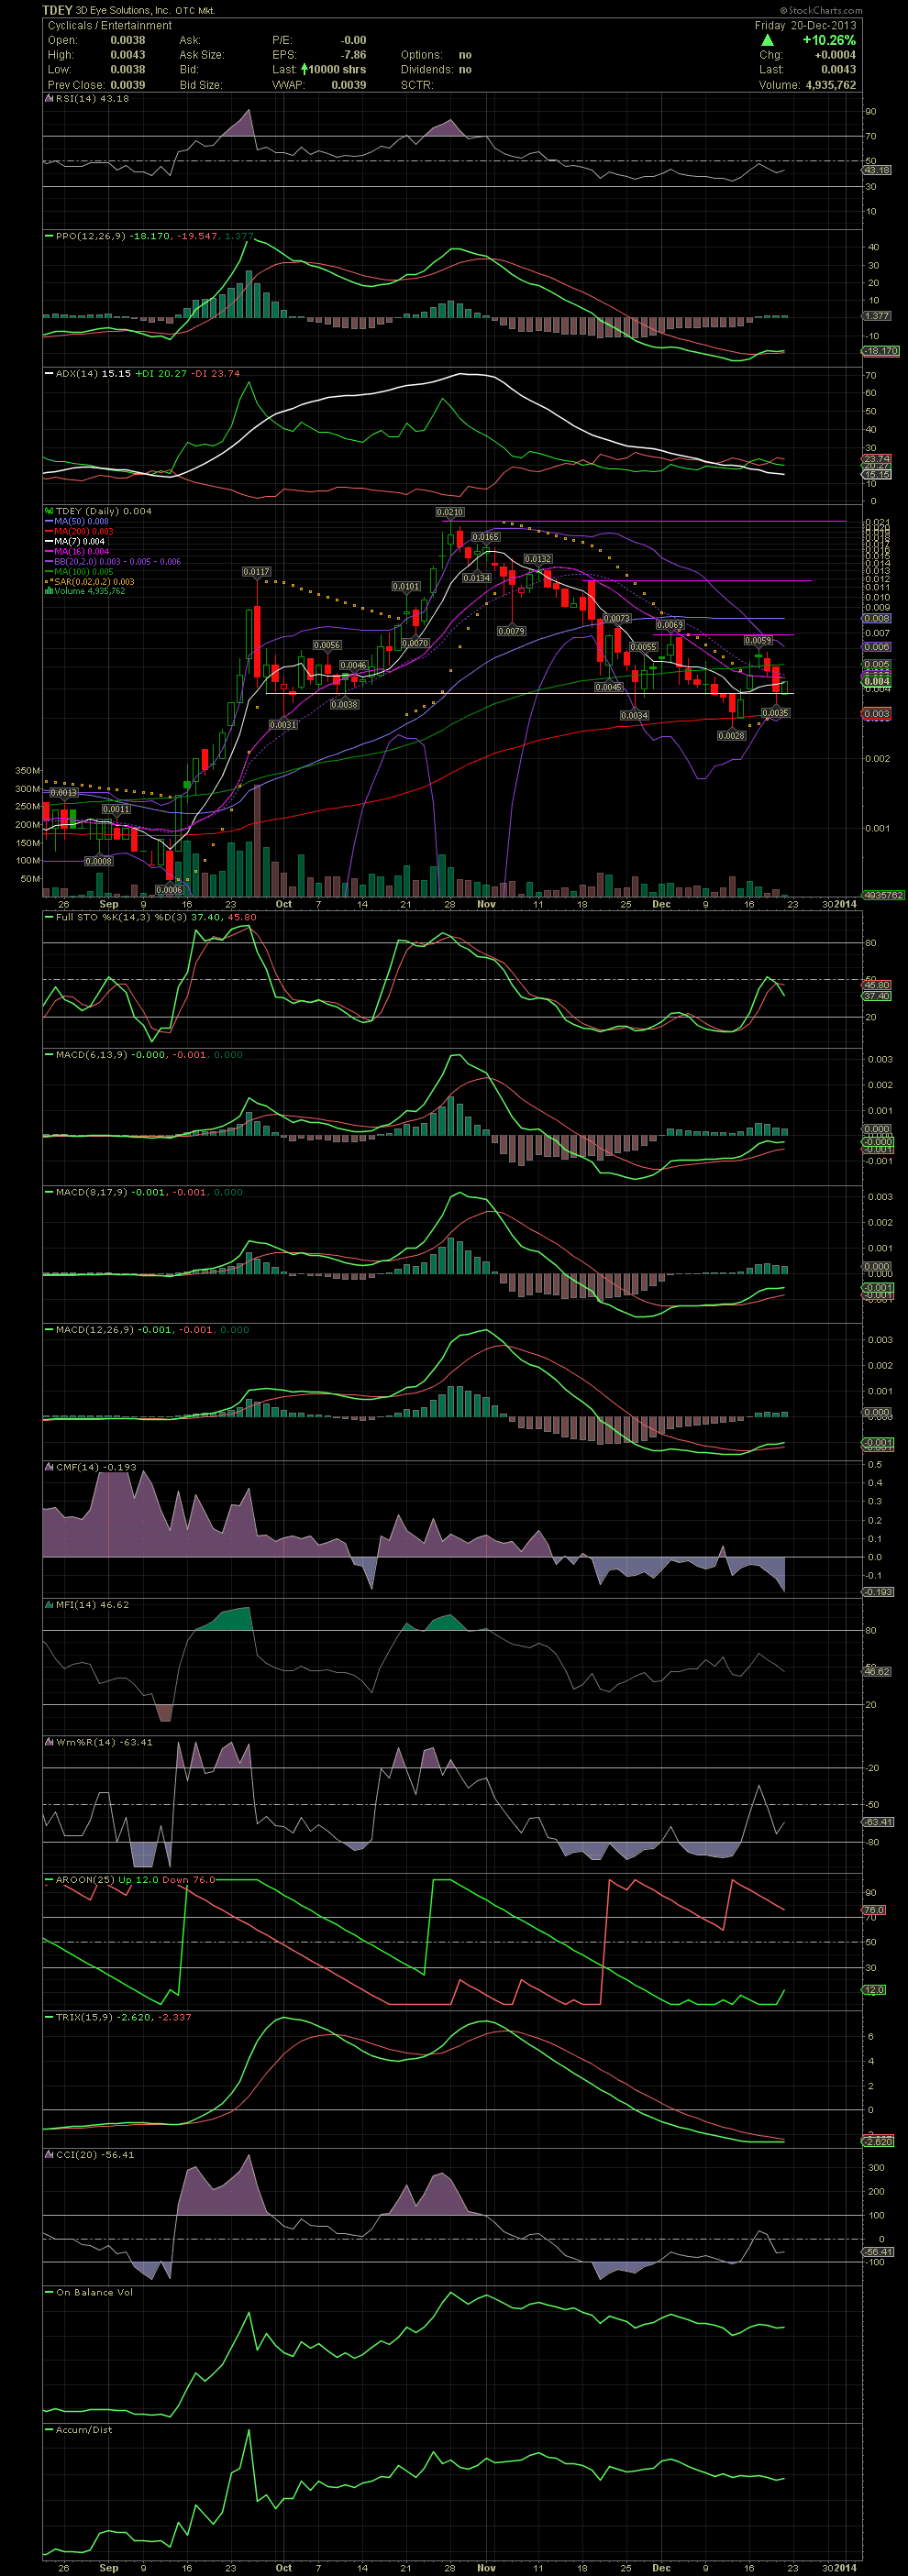
TDEY Daily Chart ~ Trying to Hold the Support Line
A ton of pumping and bashing going on with this one. Almost five weeks of holding the horizontal support line of .0039 along with a two day drop and test of the MA200. The FullSto failed to break over the 50 line but the MACEs are holding positive crossovers. I'm banking on a move to the upside. Resistance points on the way back up are many, including all the moving averages and many previous highs. It's going to be interesting to say the least. Those of you invested in TDEY might look at the weekly chart. The long term view actually shows TDEY in an overall uptrend. The next week or two will tell the tale. GLTA
A ton of pumping and bashing going on with this one. Almost five weeks of holding the horizontal support line of .0039 along with a two day drop and test of the MA200. The FullSto failed to break over the 50 line but the MACEs are holding positive crossovers. I'm banking on a move to the upside. Resistance points on the way back up are many, including all the moving averages and many previous highs. It's going to be interesting to say the least. Those of you invested in TDEY might look at the weekly chart. The long term view actually shows TDEY in an overall uptrend. The next week or two will tell the tale. GLTA