Posted On: 12/17/2013 11:52:21 PM
Post# of 4425
TDEY Daily Chart ~ Reversal Underway.......... BOOYAH!!
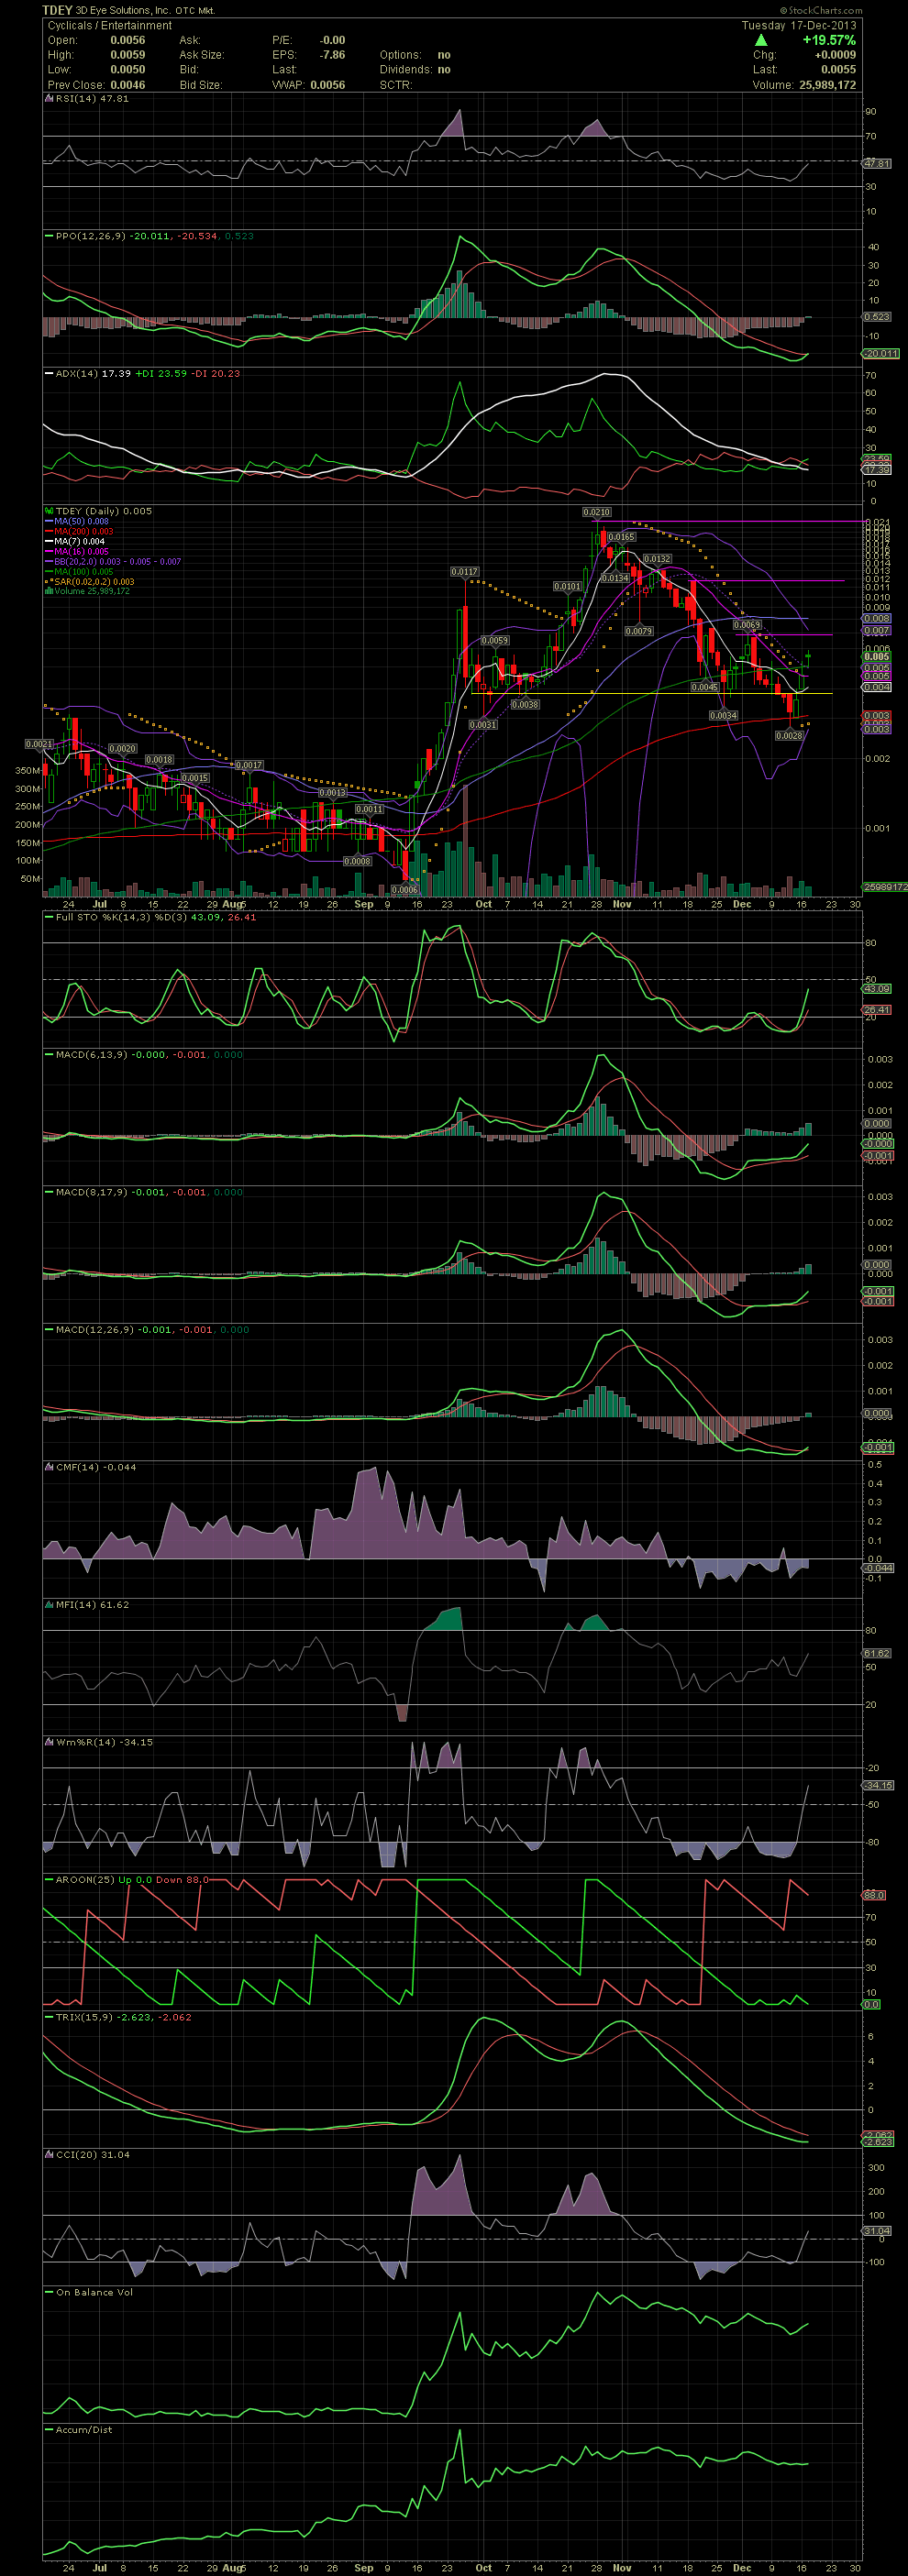
The reversal from the lows of last week were simply due to the support of the MA200. Last week, I was looking for the MA200 to hold and give an end to the multi week decline. Since then, the stock moved back over the horizontal resistance line at .0038, which has now become support once again. Additionally, the share price recaptured the MA7, 10, 16 and 20. Up next is the two day resistance point of .0069, then the MA50 at .008, followed by the very minor, one day horizontal resistance at .012. I'd like to see the volume begin to accelerate as the stock moves higher, but that might be asking for a lot since we are going into the holiday doldrums now. The FullSto and MACDs have all gone to buy signals over the last couple of days. Lastly, the PPO is also going green. Compare its position to that of the previous positive crossing for a quick idea of what the stock did the last time that occurred. GLTA

The reversal from the lows of last week were simply due to the support of the MA200. Last week, I was looking for the MA200 to hold and give an end to the multi week decline. Since then, the stock moved back over the horizontal resistance line at .0038, which has now become support once again. Additionally, the share price recaptured the MA7, 10, 16 and 20. Up next is the two day resistance point of .0069, then the MA50 at .008, followed by the very minor, one day horizontal resistance at .012. I'd like to see the volume begin to accelerate as the stock moves higher, but that might be asking for a lot since we are going into the holiday doldrums now. The FullSto and MACDs have all gone to buy signals over the last couple of days. Lastly, the PPO is also going green. Compare its position to that of the previous positive crossing for a quick idea of what the stock did the last time that occurred. GLTA


