Posted On: 12/17/2013 11:18:28 PM
Post# of 2561

MRIN Daily Chart ~ Going Higher
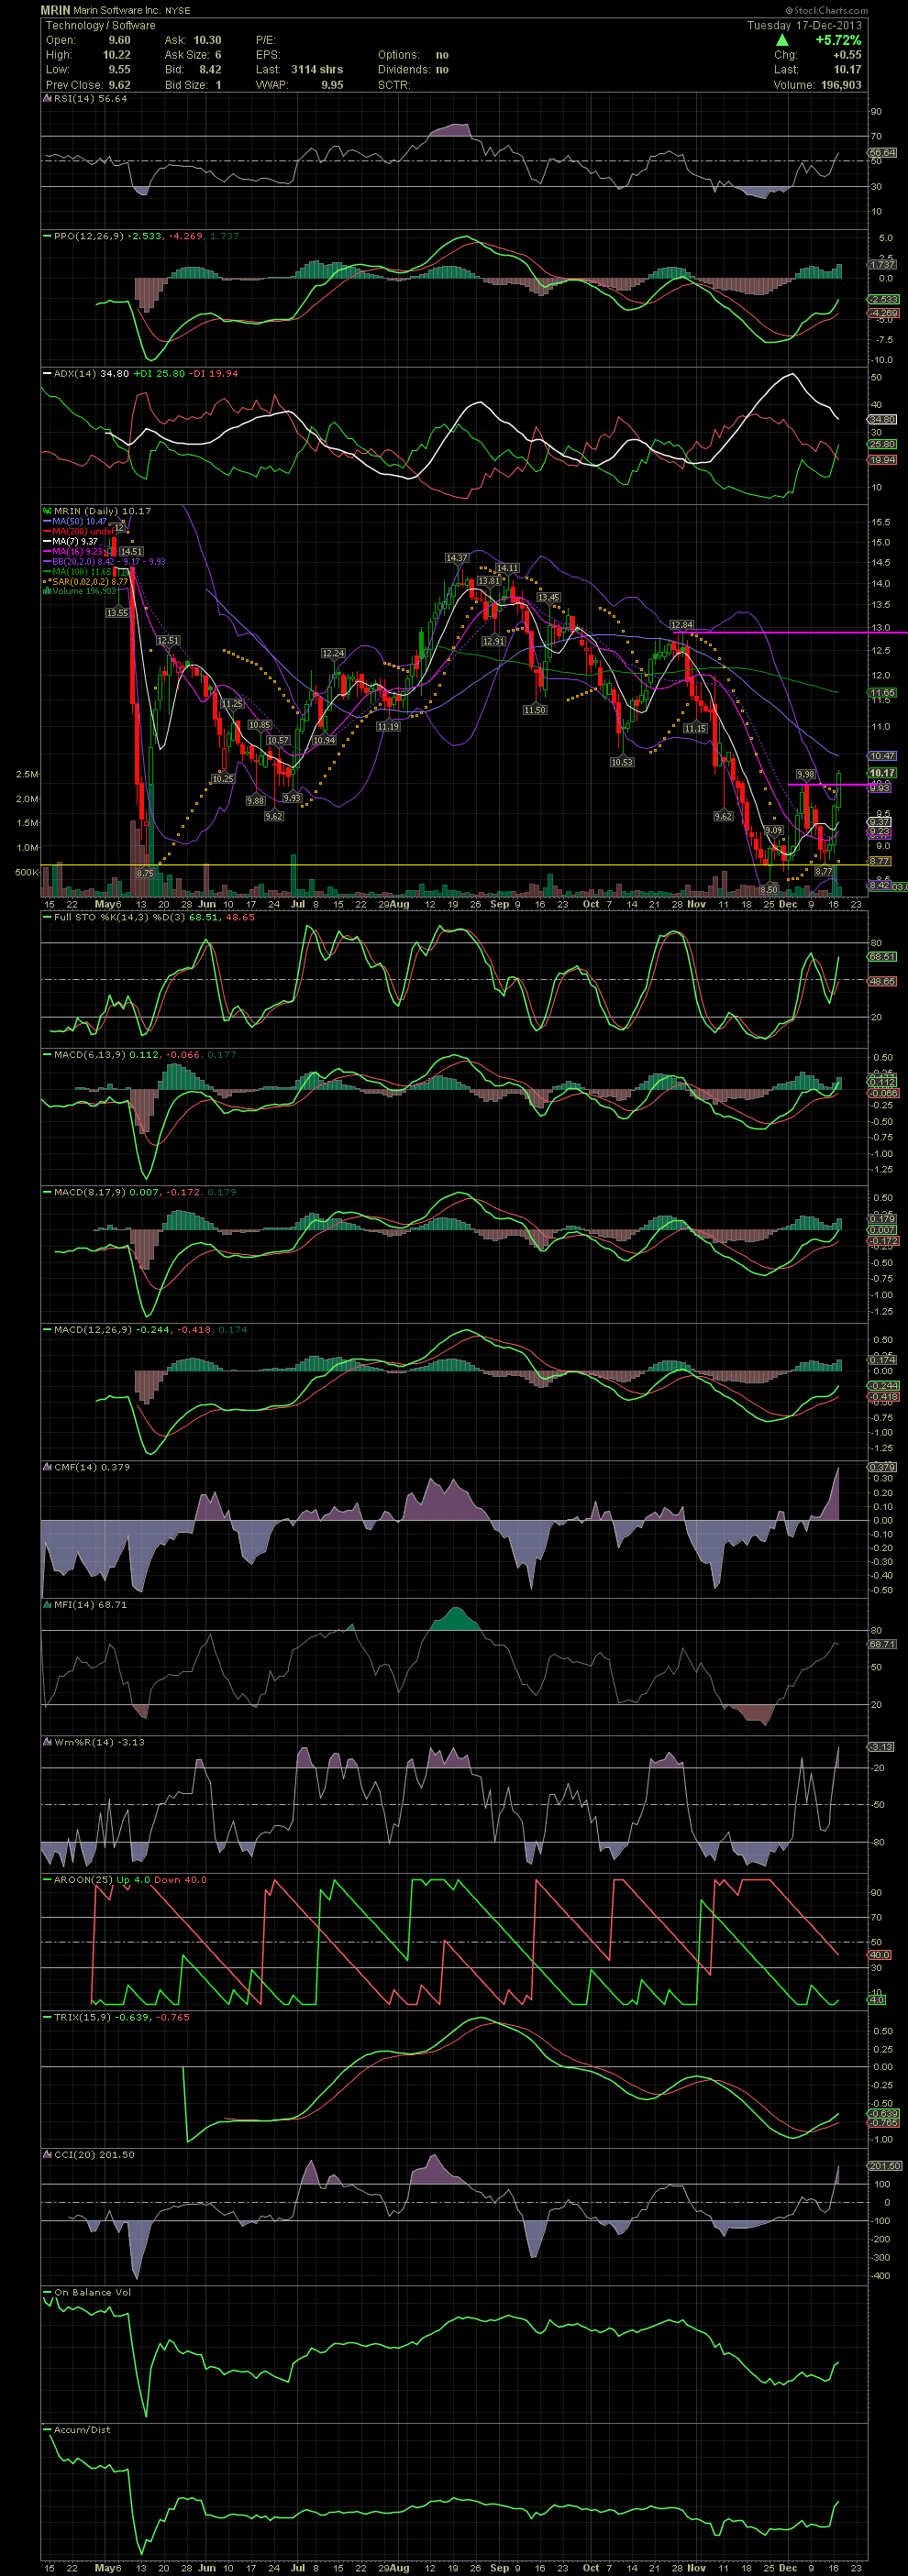
Link back to the last few charts of MRIN for thoughts about the pinch and double bottom. As I shared previously, our first entries from 8.79 to 8.94 were sold in the high 9.70s to 9.81 when the stock failed to break to and over the 10.00 level. A retest of the double bottom occurred last week, and we bought back in again. Since then, MRIN has bounced off 8.77 and rallied thru the MA7, 10, 16, and 20. The break and close above last week's high of 9.98 happened today closing at 10.17. Next up is the MA50 at 10.47, followed by the MA100 at 11.55, and then the horizontal resistance at 12.84. The semiconductor sector is in vogue again, so I'm optimistic about our chance for some strong follow through for those who entered for a second swing trade in the 8.80s/8.90s. GLTA

Link back to the last few charts of MRIN for thoughts about the pinch and double bottom. As I shared previously, our first entries from 8.79 to 8.94 were sold in the high 9.70s to 9.81 when the stock failed to break to and over the 10.00 level. A retest of the double bottom occurred last week, and we bought back in again. Since then, MRIN has bounced off 8.77 and rallied thru the MA7, 10, 16, and 20. The break and close above last week's high of 9.98 happened today closing at 10.17. Next up is the MA50 at 10.47, followed by the MA100 at 11.55, and then the horizontal resistance at 12.84. The semiconductor sector is in vogue again, so I'm optimistic about our chance for some strong follow through for those who entered for a second swing trade in the 8.80s/8.90s. GLTA

