Posted On: 12/16/2013 1:16:01 AM
Post# of 2561

TDEY Daily Chart ~ A Successful Bounce off the MA200 on Thursday, Followed With a Bounce on Friday
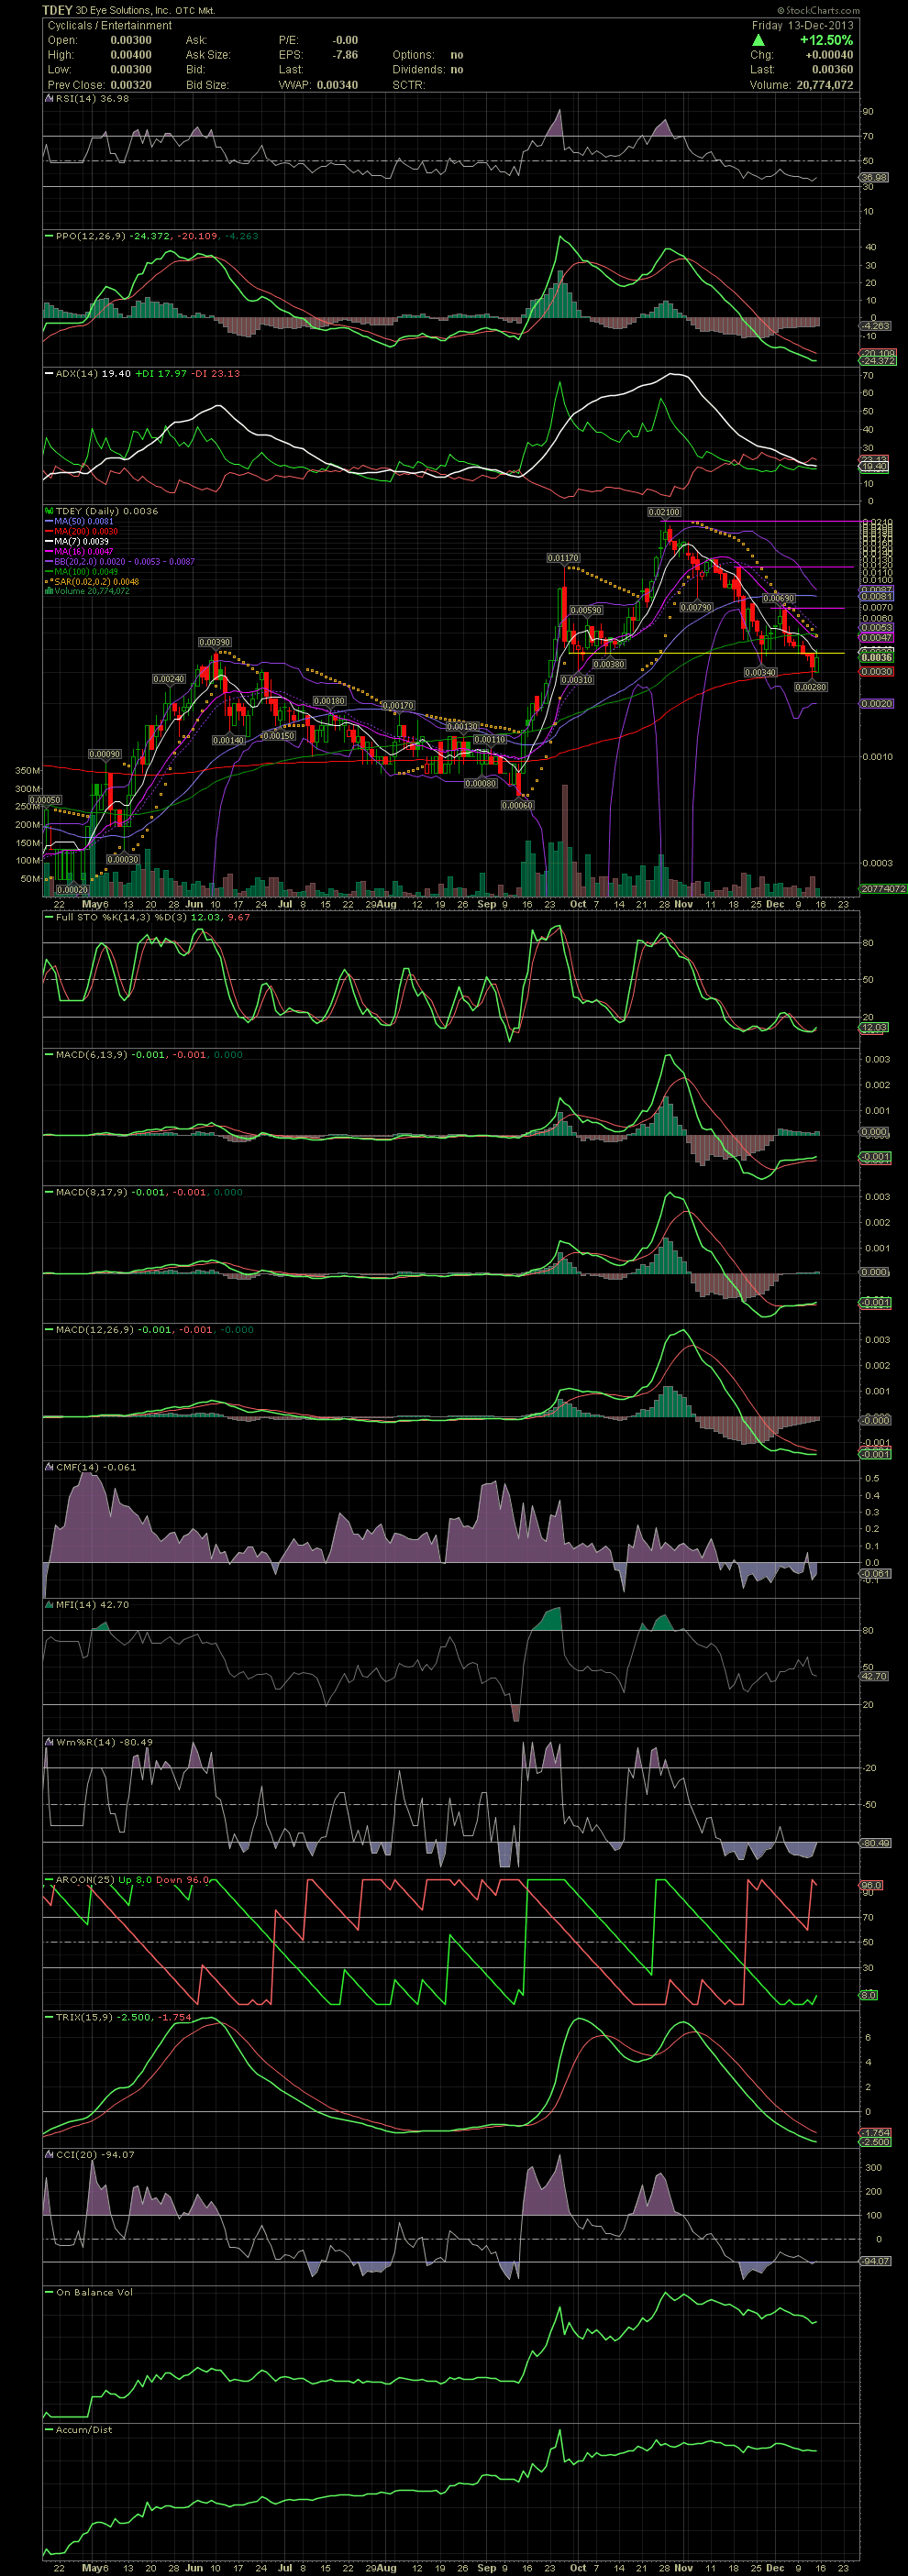
The bottom for TDEY could be in. What would be important to see now would be for the stock to move and close back above the previous support line (yellow) which is now resistance. Although I'm not expecting a problem getting over this resistance, tomorrow's action will give us a good idea of what we can expect over the next few days. The previous horizontal support lines (pink) are now considered resistance points on the way back up. The FullSto is crossing into the positive from very oversold levels. The faster MACDs are already green, while the 12d MACD has flattened out and ready to cross to the upside. Any news of substance should take TDEY much higher. Holding a fair amount of shares here with friends. GLTA

The bottom for TDEY could be in. What would be important to see now would be for the stock to move and close back above the previous support line (yellow) which is now resistance. Although I'm not expecting a problem getting over this resistance, tomorrow's action will give us a good idea of what we can expect over the next few days. The previous horizontal support lines (pink) are now considered resistance points on the way back up. The FullSto is crossing into the positive from very oversold levels. The faster MACDs are already green, while the 12d MACD has flattened out and ready to cross to the upside. Any news of substance should take TDEY much higher. Holding a fair amount of shares here with friends. GLTA

