Posted On: 12/10/2013 11:08:12 PM
Post# of 2561

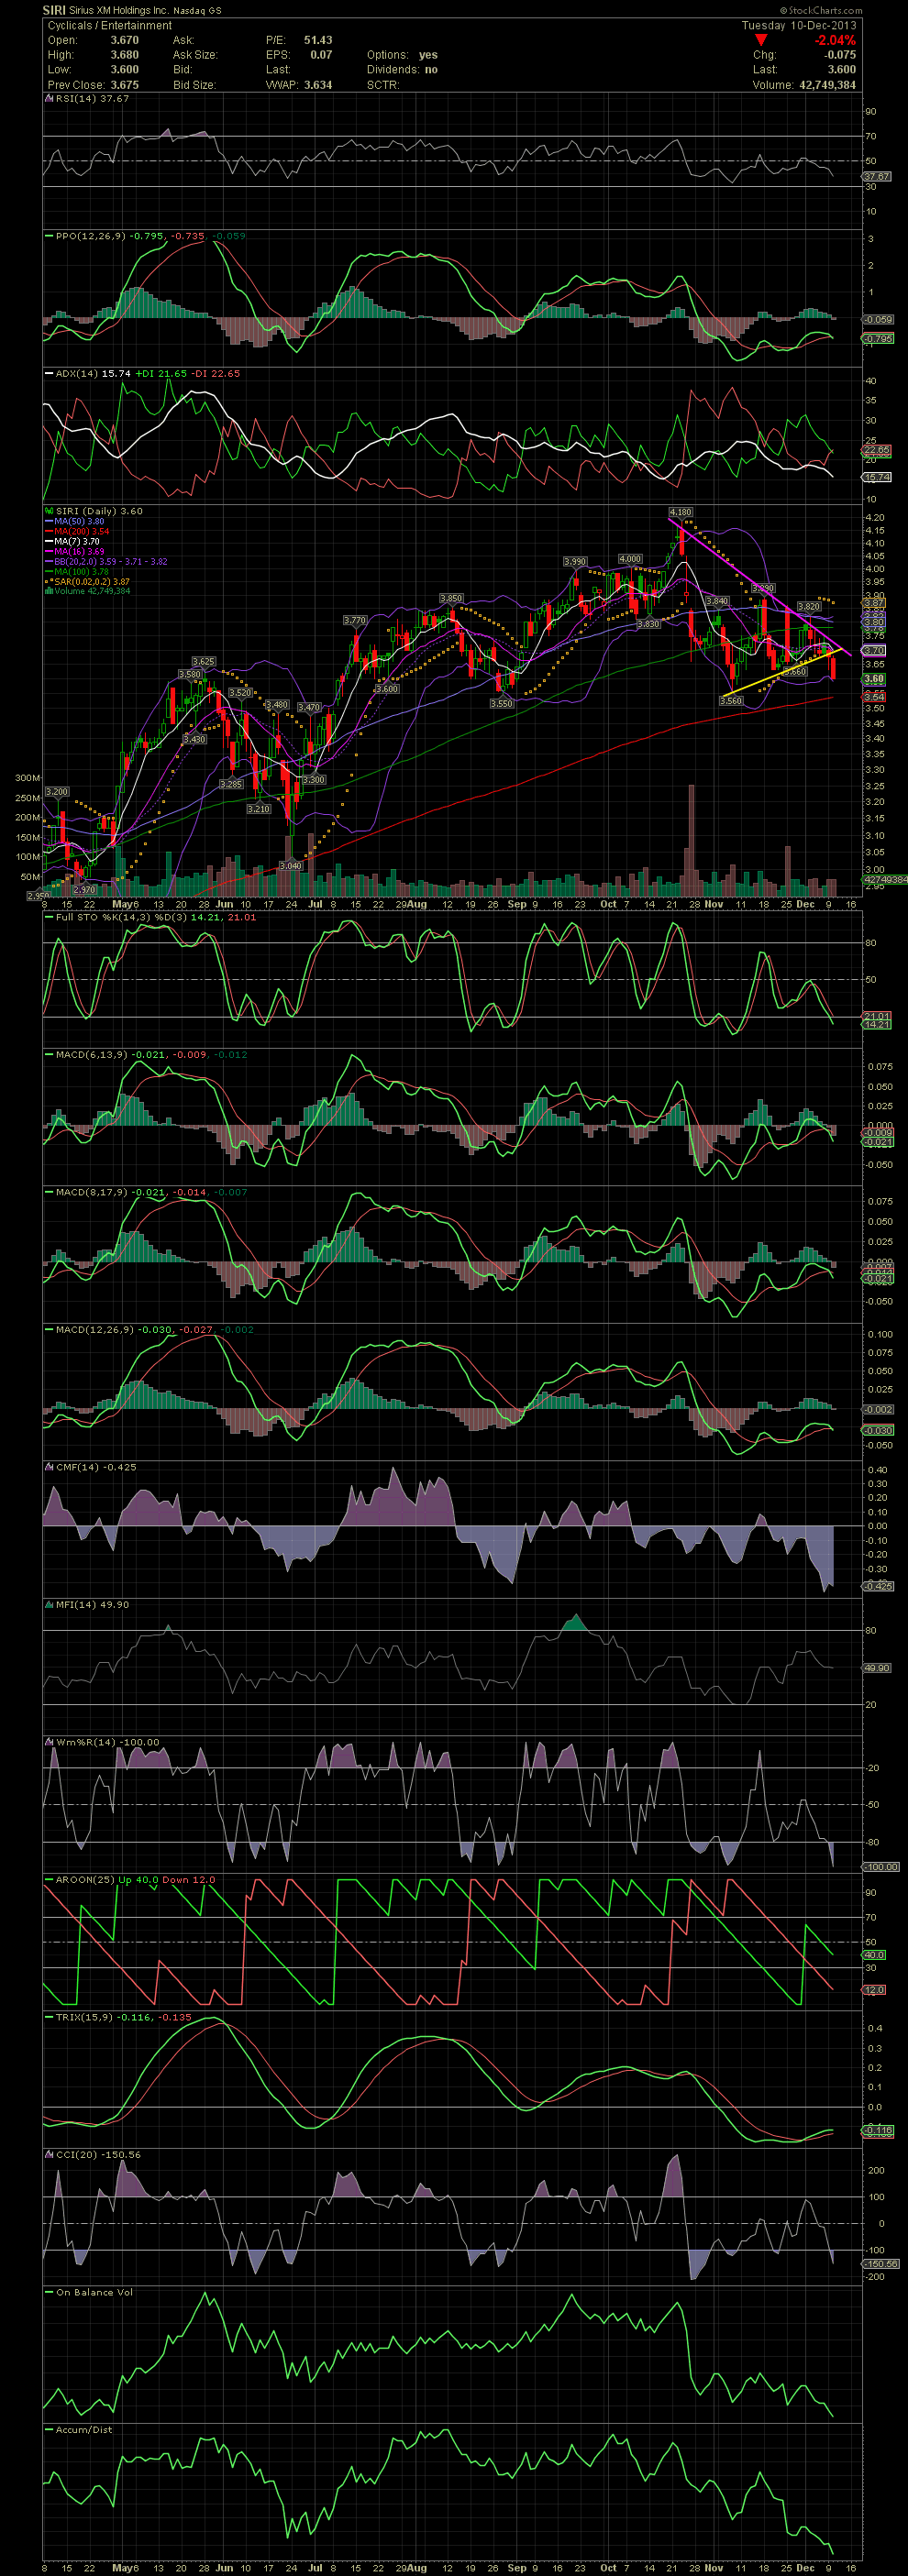
SIRI Daily Chart ~ Short Term Breakdown Underway
Sold SIRI (link back) two days ago at 3.77/3.81 when the declining tops line couldn't be taken out. Since then, the stock has broken under the rising support line. The FullSto and MACDs have crossed to the downside. First target for a possible re-entry would be the MA200 at 3.54. There were also two previous bottoms at 3.55 and 3.56. So a calculated enter for a few shares would make sense in the mid 3.50s. Should that support not hold, SIRI could head towards the low 3.00s.
Sold SIRI (link back) two days ago at 3.77/3.81 when the declining tops line couldn't be taken out. Since then, the stock has broken under the rising support line. The FullSto and MACDs have crossed to the downside. First target for a possible re-entry would be the MA200 at 3.54. There were also two previous bottoms at 3.55 and 3.56. So a calculated enter for a few shares would make sense in the mid 3.50s. Should that support not hold, SIRI could head towards the low 3.00s.