Posted On: 12/10/2013 2:03:43 AM
Post# of 3844

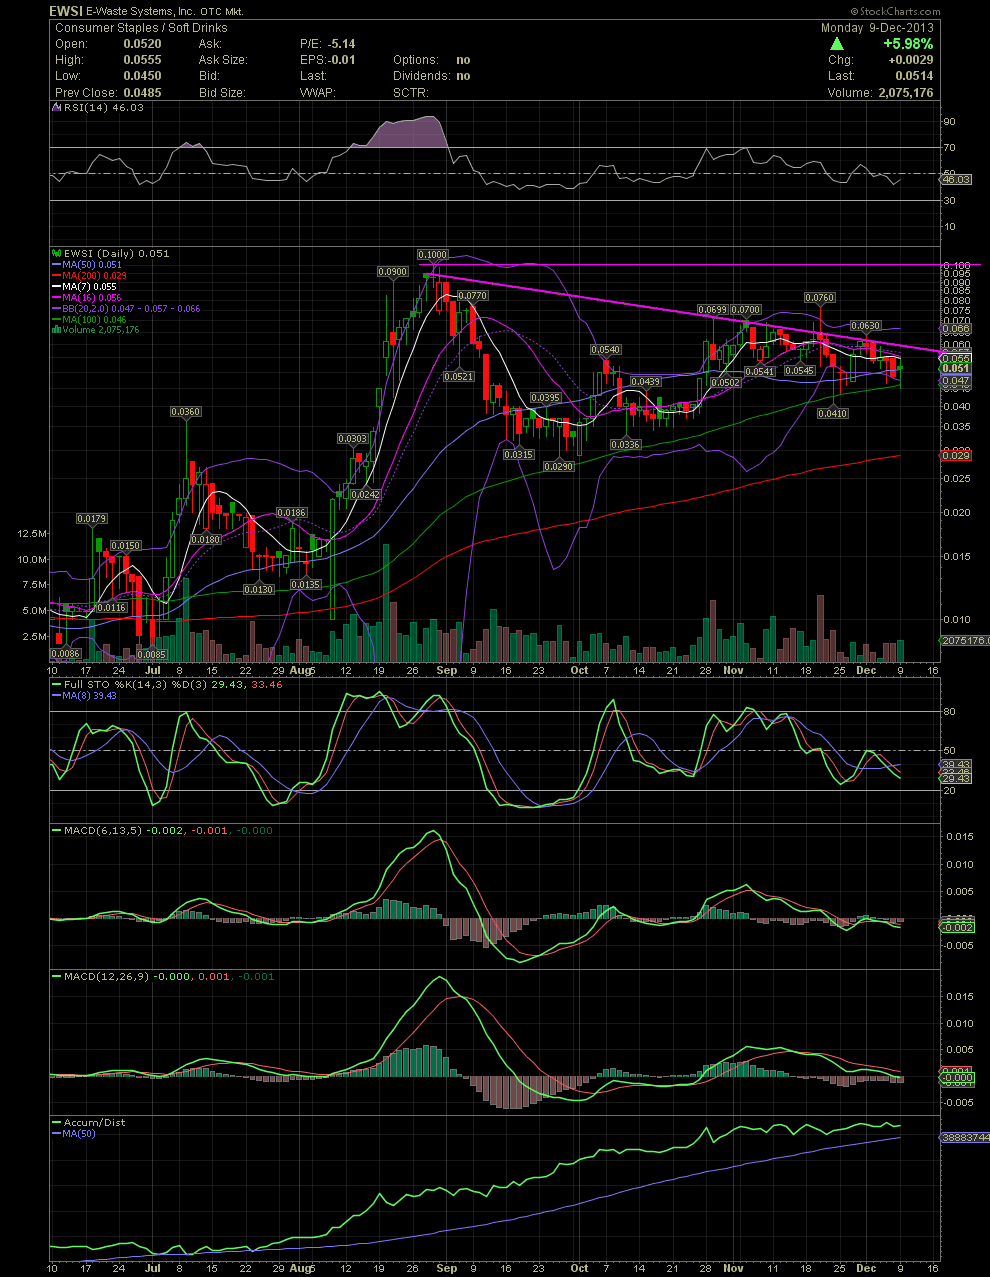
EWSI Daily Chart ~ Looking for a Break and Close Over the Declining Tops Line
Hello to all the new members of Investors Hangout and fellow EWSI shareholders. I began a position at .06 a few weeks above but have added into the .04s. I would like to end up with 500k or more before the stock moves up too high, but it sounds like I'm running out of time quickly, if I'm reading the board correctly.
On to the charts and technicals. The basic EWSI chart obviously shows a declining tops line which rests at approx .0585 today. A failed breakout in mid November happened while the share price traded a bit too far outside the upper bollie. The FullSto and MACDs had already crossed over into a negative position, so the pullback was expected. Currently, the stock is finding support of the MA50 and 100. The FullSto, which is almost entering very oversold levels near its 50 line, and MACDs, in negative territory but appear to be leveling out somewhat. Accumulation continues strong since late July. I would be looking for a breakout above the declining tops line along with closes above the various horizontal resistance points of the previous highs, .063, .07, and .076. Should EWSI capture those levels, then a test of the .10 high should occur quickly. I'm looking forward to some great DD from those that have already shared quite a bit. GLTA

