Posted On: 12/04/2013 11:21:23 PM
Post# of 2561

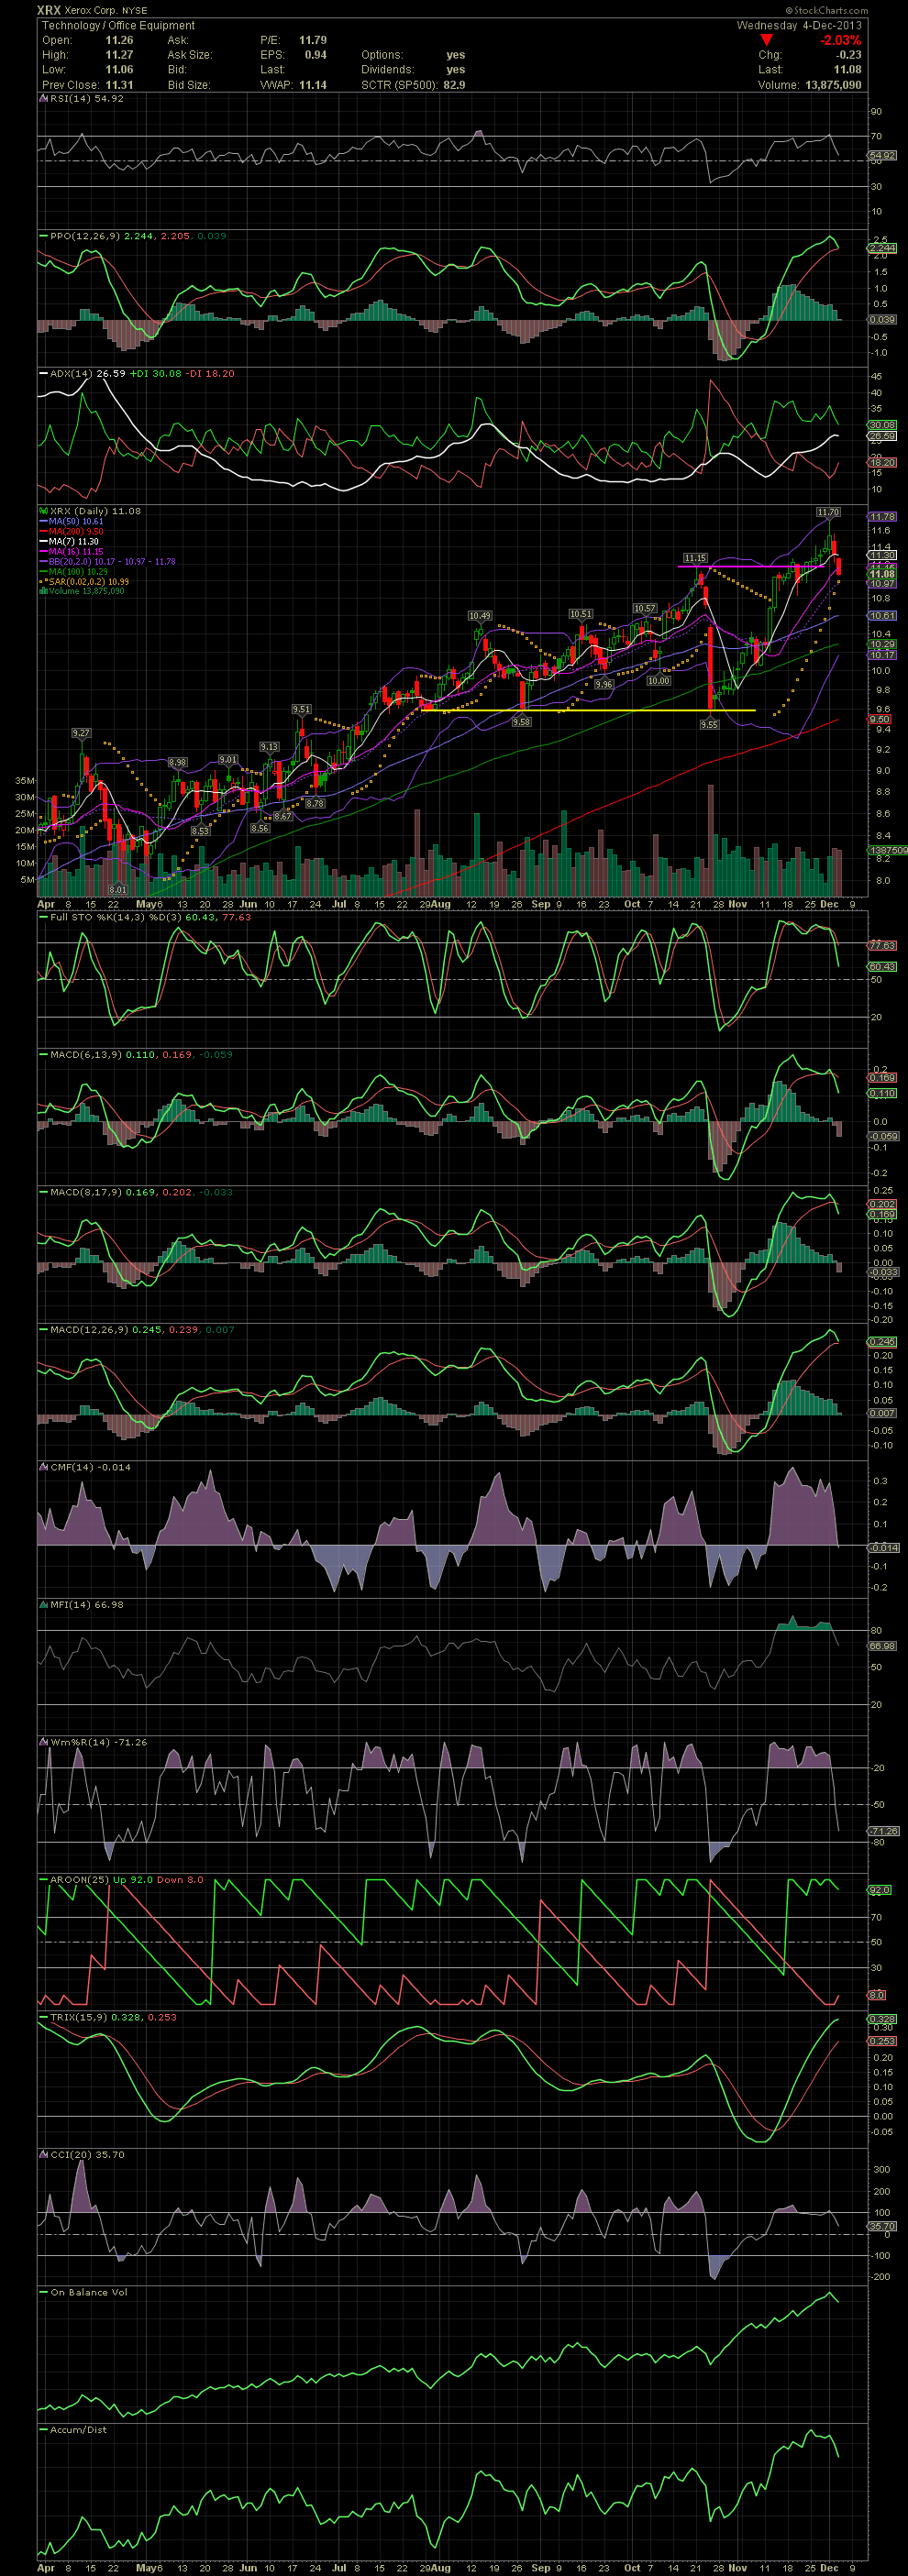
XRX Daily Chart ~ Chart Began Breaking Down on Monday
As I mentioned on my last XRX Daily Chart post, I would have my sell trigger ready as the indicators were fairly overbought. Most of the shares were sold in the 11.30s with entries from the 9.60s to low 10.00s. No idea if the stock will reverse shortly or continue falling more. The stock broke the minor support at 11.15, while the FullSto and MACDs have crossed to the negative side. You can follow the various crossovers both positive and negative quite easily on the chart below. Now we'll wait to see when the chart begins to reset. GLTA
As I mentioned on my last XRX Daily Chart post, I would have my sell trigger ready as the indicators were fairly overbought. Most of the shares were sold in the 11.30s with entries from the 9.60s to low 10.00s. No idea if the stock will reverse shortly or continue falling more. The stock broke the minor support at 11.15, while the FullSto and MACDs have crossed to the negative side. You can follow the various crossovers both positive and negative quite easily on the chart below. Now we'll wait to see when the chart begins to reset. GLTA