Posted On: 11/24/2013 7:21:14 PM
Post# of 2561

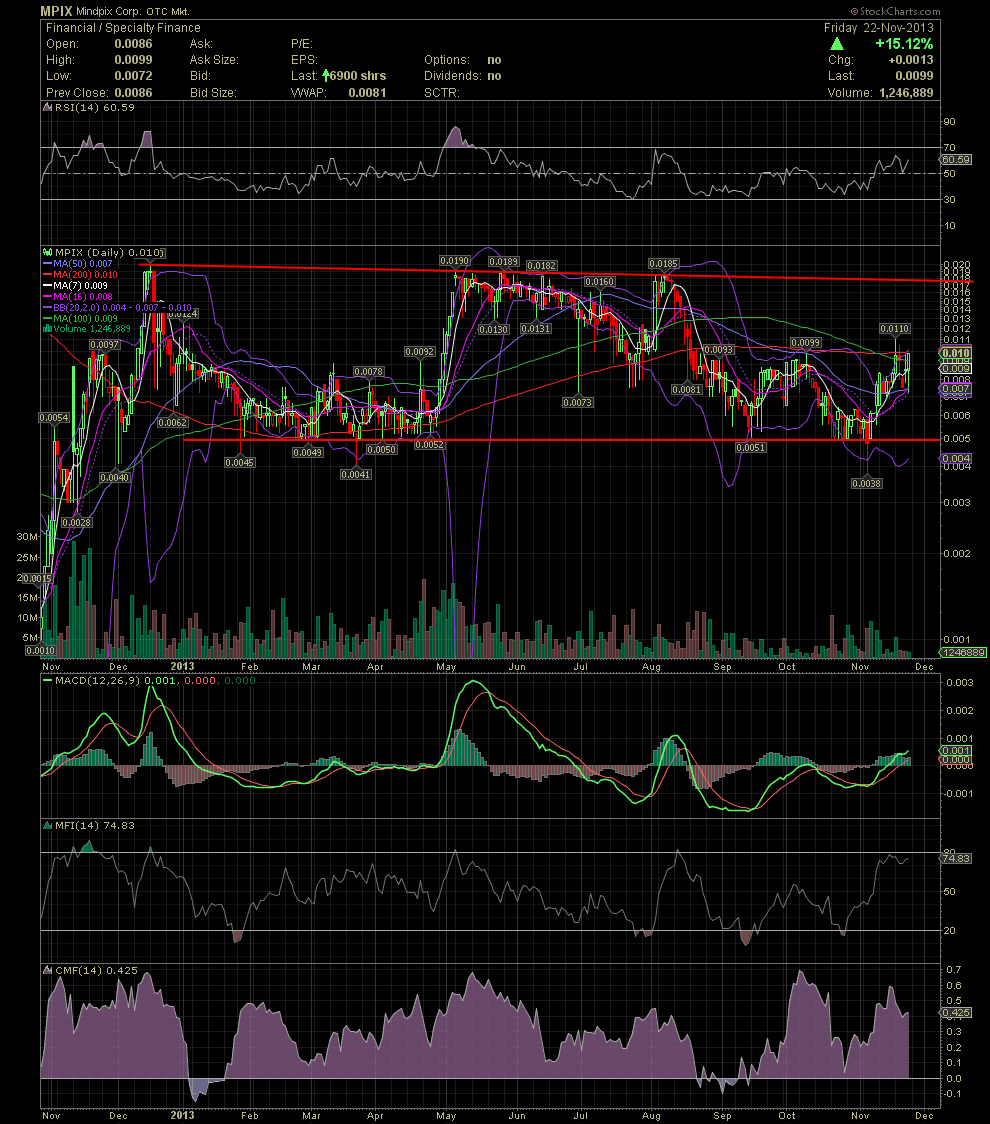
MPIX Daily Chart ~ The Longer Term Picture
I always like to show the longer term chart, in this case a 14 month shot, as it clearly shows the support levels and resistance points since many of us began accumulating from the .000s. And a lot of those shares are going long term as every week passes. For some of us, that's more than 12 bags so far at long term capital gain rates. GLTA
I always like to show the longer term chart, in this case a 14 month shot, as it clearly shows the support levels and resistance points since many of us began accumulating from the .000s. And a lot of those shares are going long term as every week passes. For some of us, that's more than 12 bags so far at long term capital gain rates. GLTA