Posted On: 11/21/2013 12:18:43 AM
Post# of 1187

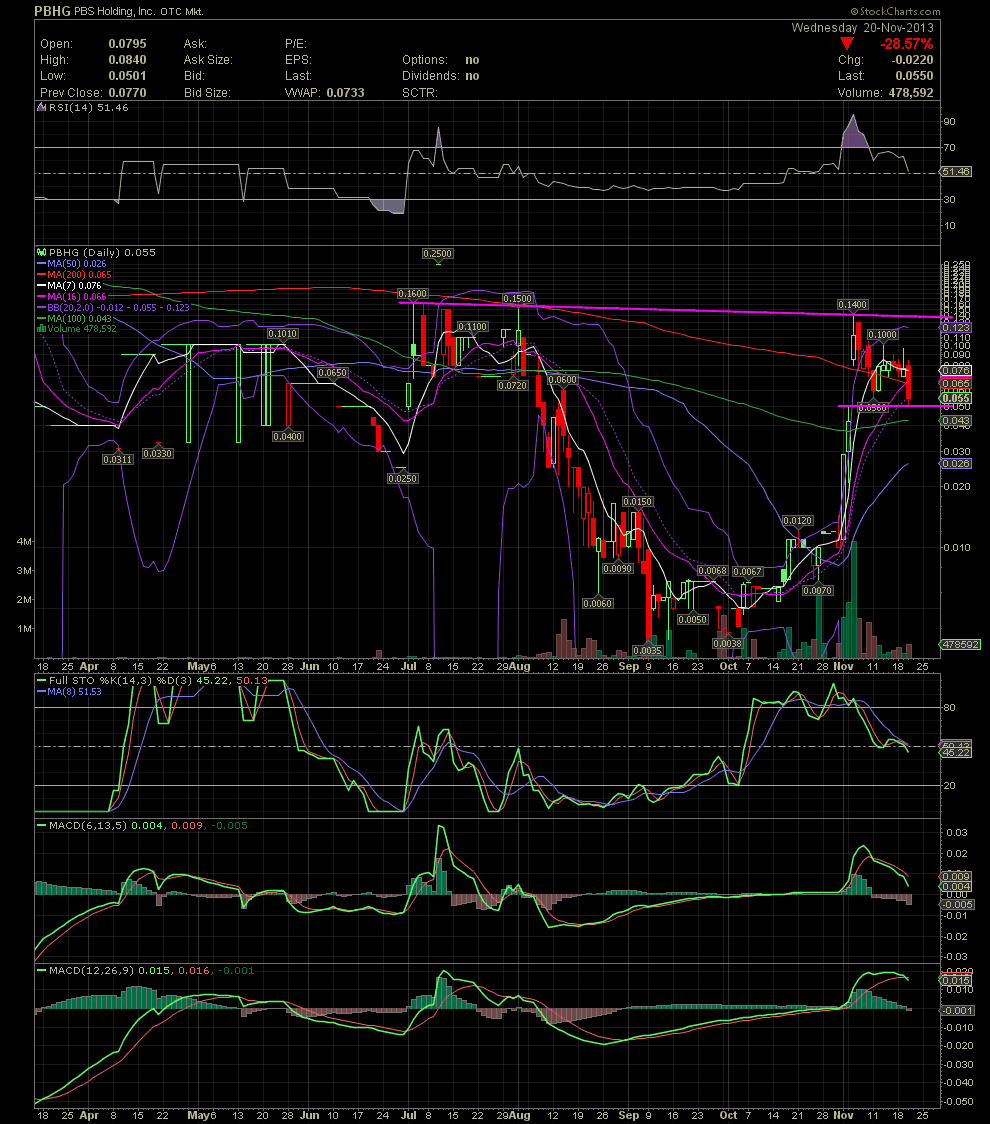
PBGH Daily Chart ~ Bounce Time After Finding Support at the Previous High
In addition to finding some support at the previous high prior to the run to .14, some technicians who might subscribe to the gap theory, might see that the gap was filled today. Others following gaps would rather see a full candle body filling a gap. Although most indicators are already oversold, they aren't offering a buy signal yet. Nevertheless, the chart is resetting from extremely overbought conditions of two weeks ago. Not sure if one could call today's trading total capitulation, often the sign of a reversal, but we are close imo. Either way, today's manipulations of the stocks of PBHG and TDEY should see some relief shortly. GLTA
In addition to finding some support at the previous high prior to the run to .14, some technicians who might subscribe to the gap theory, might see that the gap was filled today. Others following gaps would rather see a full candle body filling a gap. Although most indicators are already oversold, they aren't offering a buy signal yet. Nevertheless, the chart is resetting from extremely overbought conditions of two weeks ago. Not sure if one could call today's trading total capitulation, often the sign of a reversal, but we are close imo. Either way, today's manipulations of the stocks of PBHG and TDEY should see some relief shortly. GLTA