Posted On: 11/10/2013 11:10:12 PM
Post# of 2561

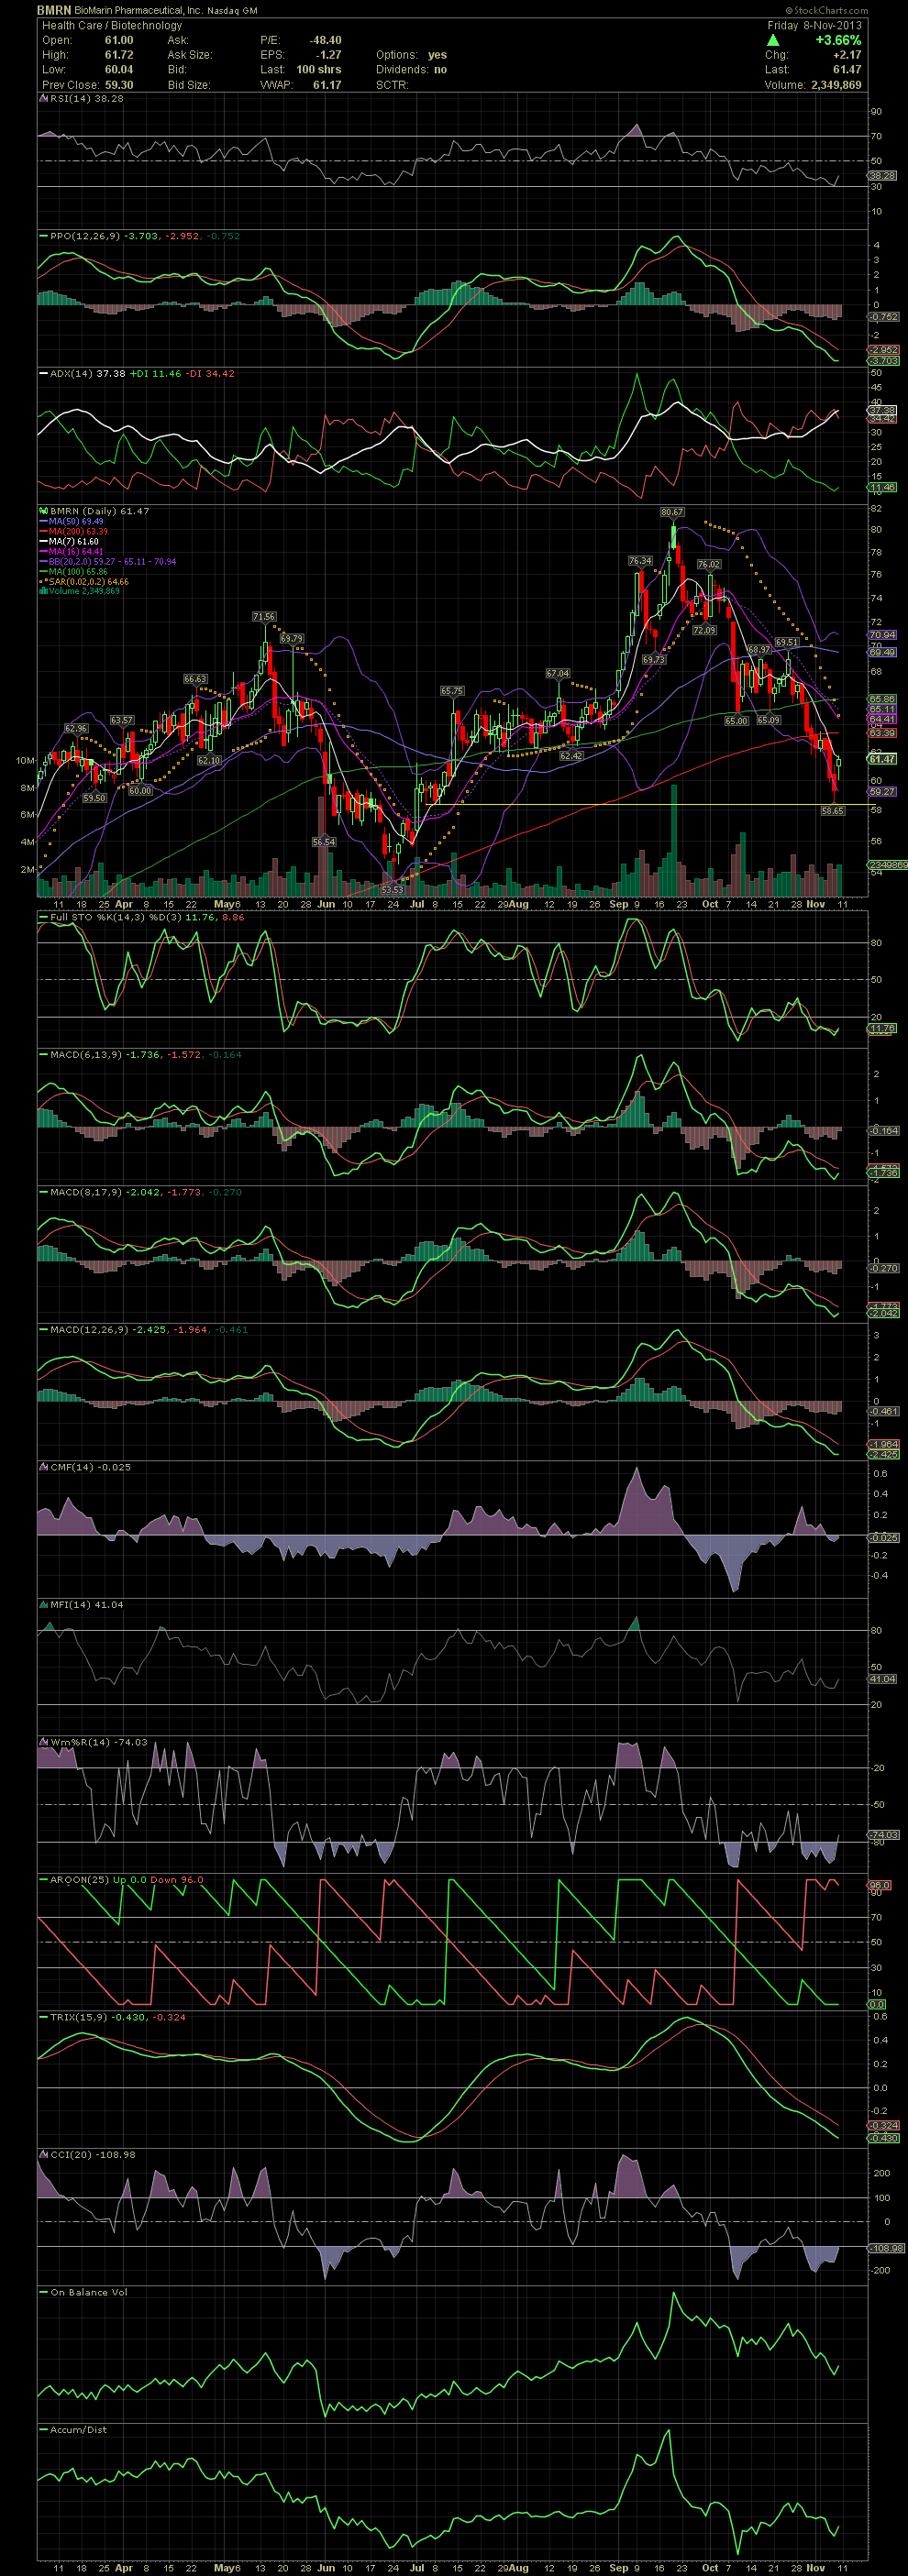
BMRN Daily Chart ~ Broken Stock, Great Company
Last week I posted the wrong chart when sharing my thoughts on waiting for an entire to BMRN. Using the horizontal support of early July prior to the breakout from $58.60s to $80.67, one would have been re-entering or adding in the high $58's. Thursday saw just that as the stock dropped to $58.65 during oversold conditions of many indicators. A pinch of the ADX and PPO is also beginning to develop. A couple of us bought on Thursday. We'll see how we do. Should the stock break under the yellow support line, I would be looking for the $53.53 low of late June for another level to add at.
Last week I posted the wrong chart when sharing my thoughts on waiting for an entire to BMRN. Using the horizontal support of early July prior to the breakout from $58.60s to $80.67, one would have been re-entering or adding in the high $58's. Thursday saw just that as the stock dropped to $58.65 during oversold conditions of many indicators. A pinch of the ADX and PPO is also beginning to develop. A couple of us bought on Thursday. We'll see how we do. Should the stock break under the yellow support line, I would be looking for the $53.53 low of late June for another level to add at.