Posted On: 11/02/2013 9:44:08 PM
Post# of 2561

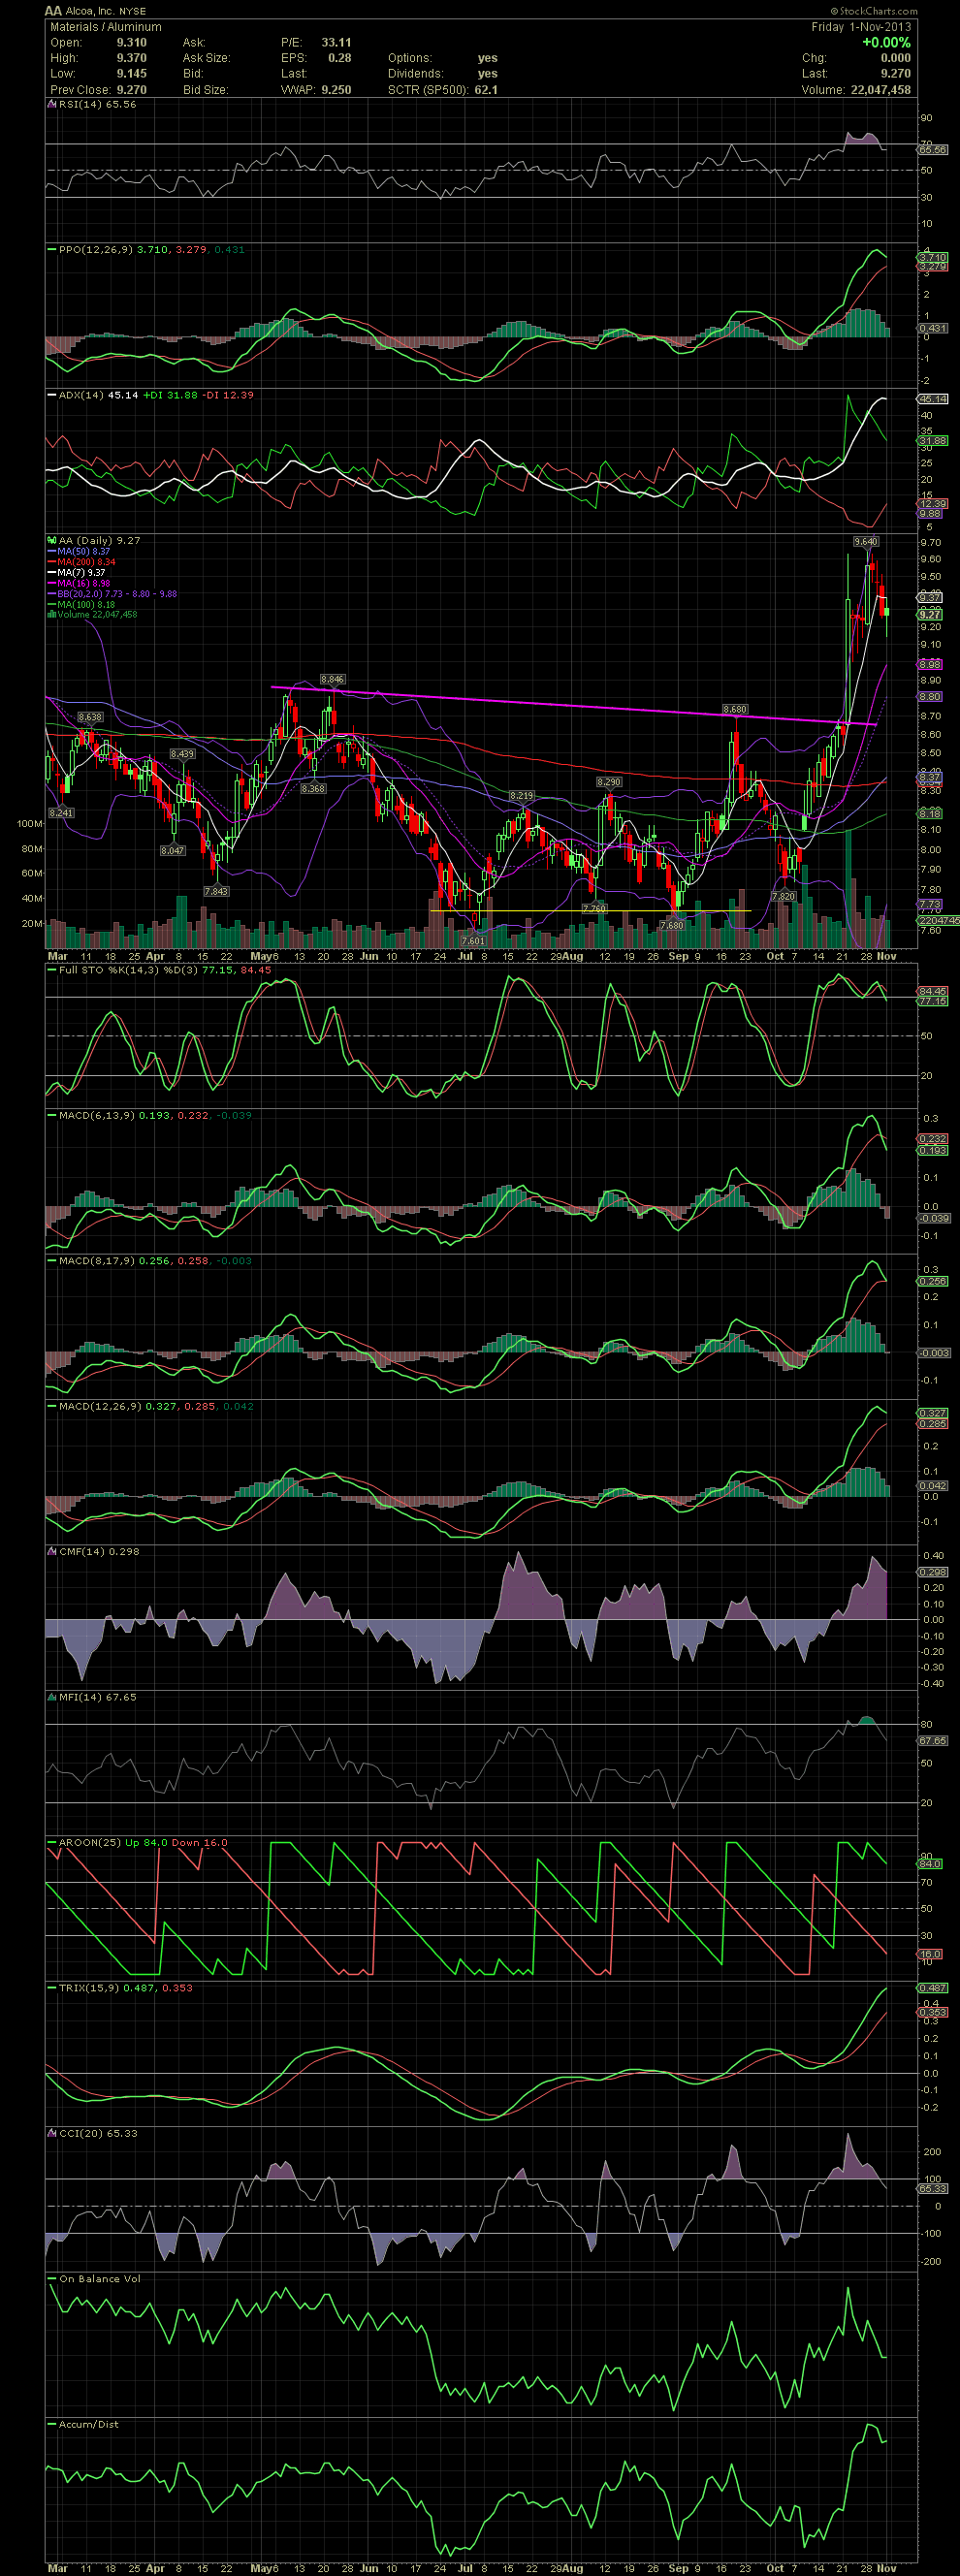
AA Daily Chart ~ Alcoa is Back!
Although I entered Alcoa later than I should have, I bought on the break above the declining tops line at 8.67. It appears a few others also felt as that point would lead to a move. Not a huge move, but over the next few days, AA saw potential returns of almost 1.00 or 11.2%, not bad for the conservative swing trader. Where I should have entered, though, is closer to the double bottom near 7.68 in early September. Since establishing a short term double top at 9.63/9.64, AA has declined approx .40 or 4.14% as the FullSto and MACDs began curling. Who says charts don't work?!
Although I entered Alcoa later than I should have, I bought on the break above the declining tops line at 8.67. It appears a few others also felt as that point would lead to a move. Not a huge move, but over the next few days, AA saw potential returns of almost 1.00 or 11.2%, not bad for the conservative swing trader. Where I should have entered, though, is closer to the double bottom near 7.68 in early September. Since establishing a short term double top at 9.63/9.64, AA has declined approx .40 or 4.14% as the FullSto and MACDs began curling. Who says charts don't work?!