Posted On: 11/02/2013 7:47:03 PM
Post# of 2561

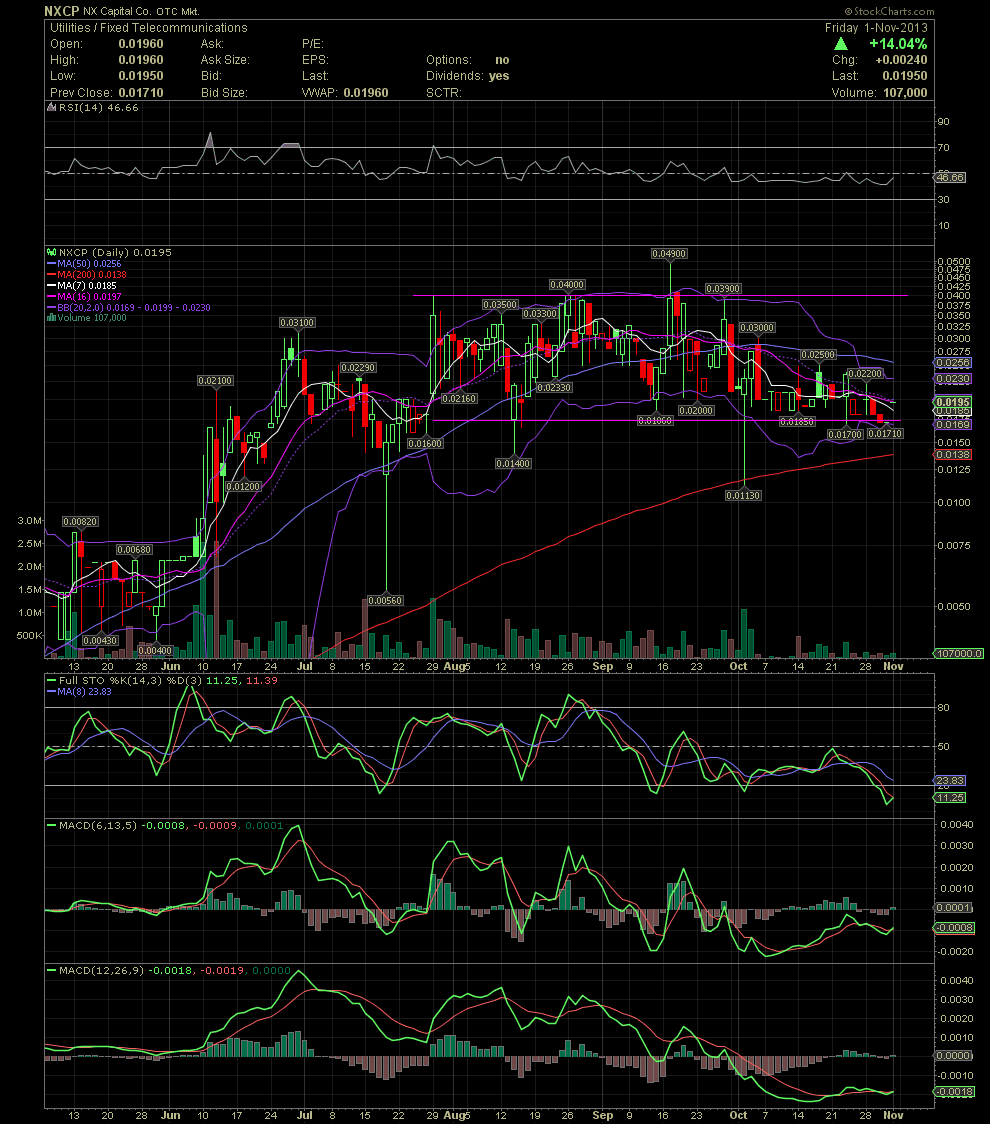
NXCP Daily Chart ~ The Chart Has Reset and Is Positioned for a Move Up
After more than two months in a gradual decline, NXCP's chart and indicators appear to be set for a move back up. The FullSto and MACDs are beginning a crossover to the upside. With approx 42 mil shares in the float, and the stock having been accumulated for weeks in the high .01s to mid .02s, any news of the uranium acquisition and filings to become current will potentially take NXCP over the recents tops near .04 and set it up for a test of the .10/.11 level. This could finally be what we've been waiting for. GLTA
After more than two months in a gradual decline, NXCP's chart and indicators appear to be set for a move back up. The FullSto and MACDs are beginning a crossover to the upside. With approx 42 mil shares in the float, and the stock having been accumulated for weeks in the high .01s to mid .02s, any news of the uranium acquisition and filings to become current will potentially take NXCP over the recents tops near .04 and set it up for a test of the .10/.11 level. This could finally be what we've been waiting for. GLTA