Posted On: 10/28/2013 12:41:57 AM
Post# of 2561

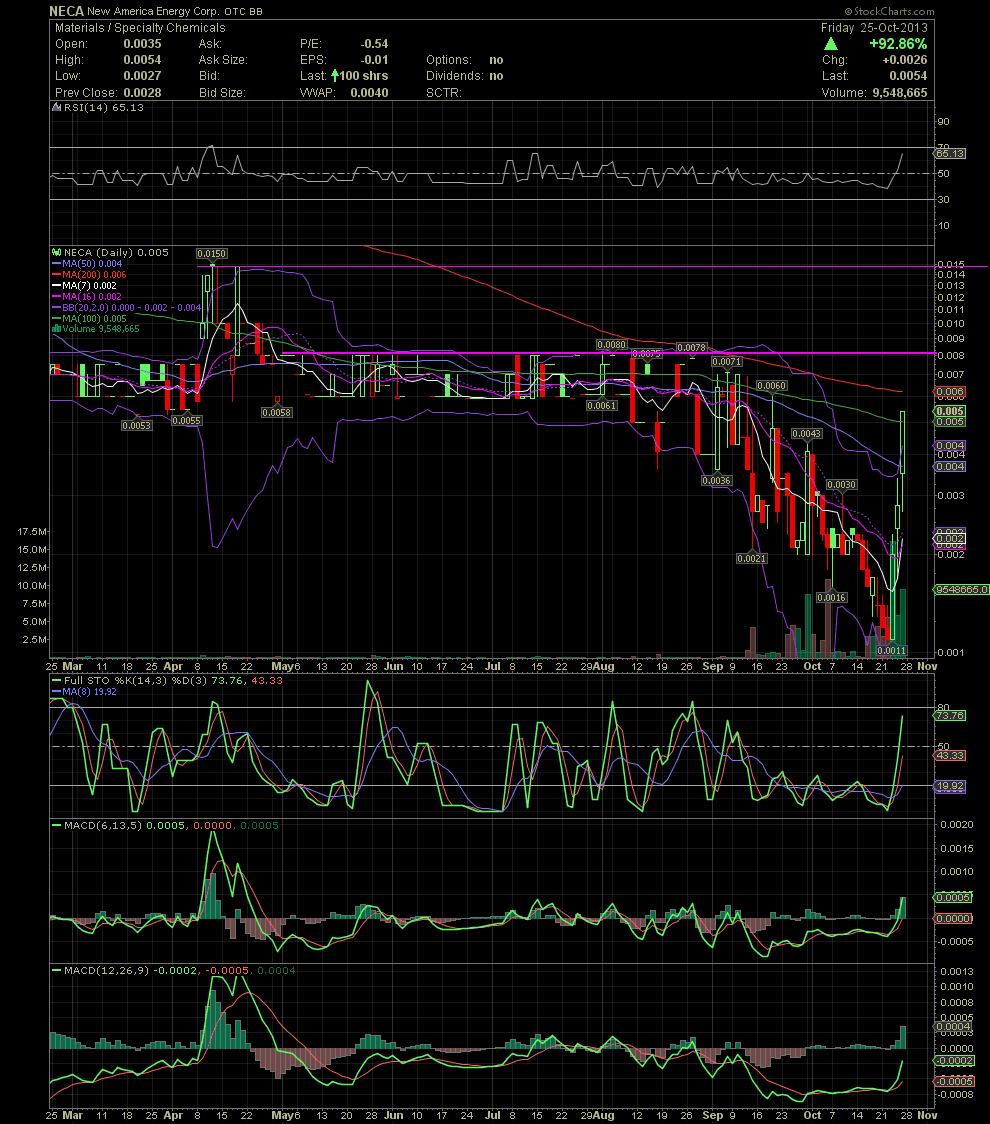
NECA Daily Chart ~ A Fantastic Week by a Call From Flex
Although I've been out in the field every day for the last three weeks, I'm still able to catch up in the evenings on the reads. Wednesday evening I read Flex's call of NECA at approx .0013. Unfortunately, I was able to enter until Thursday at .0022. Nonetheless, a big congrats and thanks to my friend Jake! As to the chart, a bounce back like NECA witnessed this week typically means something big is cookin'. A move thru the MA200 at .006 would probably bring into play a test of the horizontal resistance at .008. A break over that point, with volume, would suggest a possible move to the second resistance point at .015. I'll post a weekly chart next to further show the potential here. Thanks again Jake!!

Although I've been out in the field every day for the last three weeks, I'm still able to catch up in the evenings on the reads. Wednesday evening I read Flex's call of NECA at approx .0013. Unfortunately, I was able to enter until Thursday at .0022. Nonetheless, a big congrats and thanks to my friend Jake! As to the chart, a bounce back like NECA witnessed this week typically means something big is cookin'. A move thru the MA200 at .006 would probably bring into play a test of the horizontal resistance at .008. A break over that point, with volume, would suggest a possible move to the second resistance point at .015. I'll post a weekly chart next to further show the potential here. Thanks again Jake!!

