Posted On: 10/24/2013 1:39:15 AM
Post# of 2561

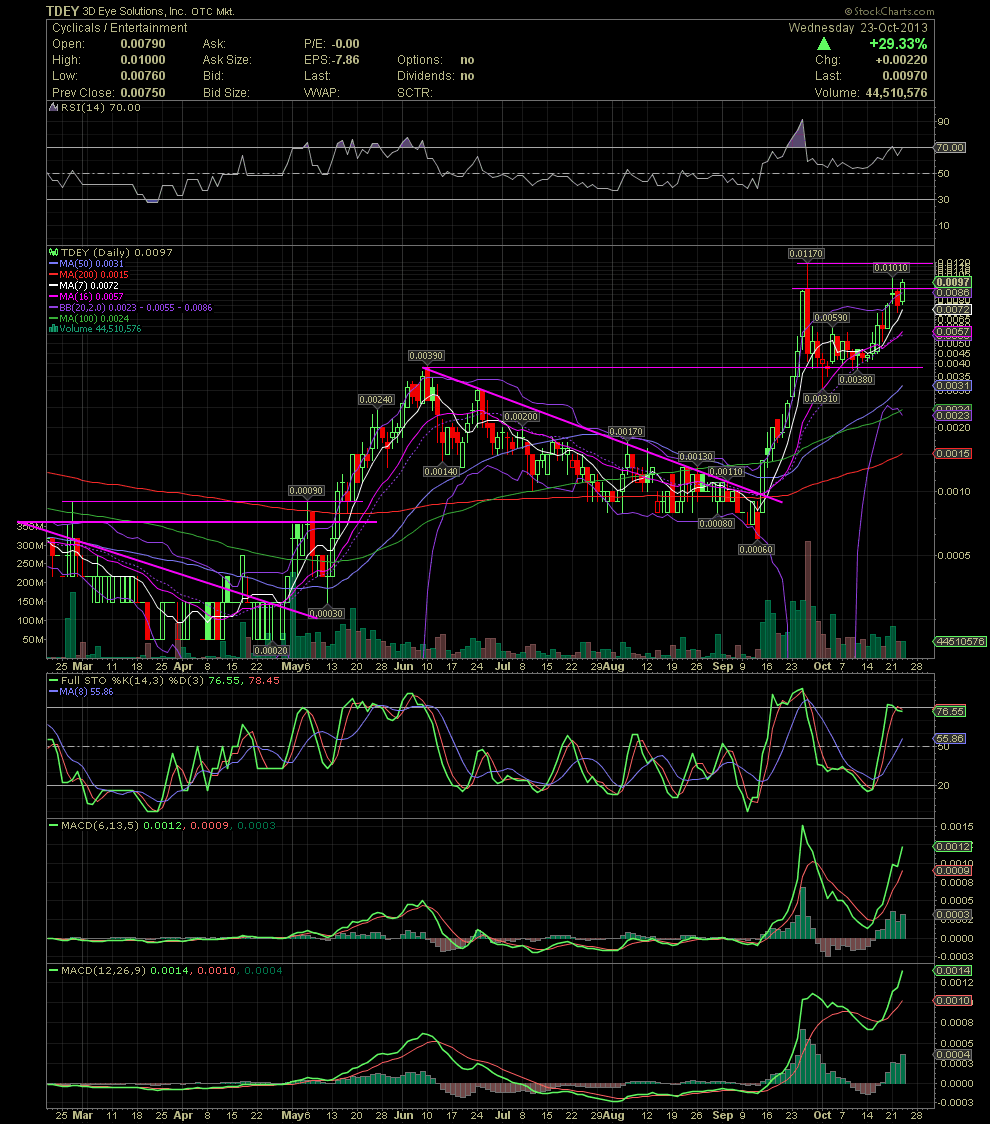
TDEY Daily Chart ~ Blue Sky Breakout Dead Ahead?
Link back to my TDEY Chart post of Sunday for comments and what the chart looked like then. The first resistance point, which I mentioned was .009, was taken out today. Next up is the .0117 which I have drawn in below as the horizontal resistance of the late September high. My guess is that it might be taken out very soon now. That would bring into play a test of the .03-.05 IMO. GLTA
Link back to my TDEY Chart post of Sunday for comments and what the chart looked like then. The first resistance point, which I mentioned was .009, was taken out today. Next up is the .0117 which I have drawn in below as the horizontal resistance of the late September high. My guess is that it might be taken out very soon now. That would bring into play a test of the .03-.05 IMO. GLTA